

432 Hours of Hyperliquid Oil Market Data: A Microstructure Comparison with CME WTI Futures
Story of three weekends of Price Discovery on Hyperliquid

This article is an excerpt from our research on Commodities evolution. Download the complete report here:
https://docsend.com/v/sjv2g/the_evolution_of_commodities

Methodology
The analysis evaluates oil market microstructure across two studies, one overlapping hours and a weekend analysis, drawing on tick-level execution data from two venues: the Hyperliquid xyz:CL perpetual contract and the CLJ6 (April 2026 NYMEX WTI futures) contract on CME.
Data Sources
CME data is sourced from the Databento trade feed, which captures tick-level executions rather than order book snapshots. As a result, all depth and slippage estimates for CME are derived from observed fills rather than quoted depth.
Hyperliquid data is sourced from Hyperliquid’s publicly accessible S3 archive, which contains the complete onchain fill record.
Both venues are therefore analysed on a fills-derived basis. All depth figures represent revealed liquidity, the volume executed within a defined basis point range of the VWAP mid per 5-minute window, rather than the full resting depth on the book.
Study Period and Market Context
The study period runs from February 27 to March 16, 2026. This window coincides with a volatile geopolitical episode following Iranian strikes on February 28, 2026.
Pre-strike market close: The final CME session before the event.
Monday Open: A high-stress reopening, with CME gapping materially higher and Hyperliquid xyz:CL market constrained by the discovery bounds.
Subsequent weekends: As oil prices remained elevated and the volatile environment kept the commodity’s trading levels high on Hyperliquid.
xyz:CL launched in early 2026, meaning the three-weekend observation window captures an early-maturation phase for the Hyperliquid market. Observed trends, including improving depth, rising volume, and growing user counts, partly reflect the market maturation.
We do not expect onchain venues to be competitive with traditional venues on absolute benchmarks such as liquidity depth or slippage (yet).
The objective is to track directional trends: whether the gap is narrowing, at what rate, and under what conditions.
The Analysis
Analysis of the data is divided into two parts during the data timeframe:
Overlapping Hours: It covers the full three-week period and compares the overlapping hours of both Hyperliquid and CME in terms of depth, slippage, and the premium/discount of one venue’s trades relative to the other. For Hyperliquid, we also analyse its funding rates during the whole period.
Weekend Analysis: In the given time frame, there are three weekends, so we analyse price discovery and Hyperliquid’s price-gap deviation relative to the CME open.
Overlapping Hours
This analysis covers the full three-week period and focuses on the hours when both venues are active simultaneously.
Depth: Revealed liquidity depth is measured as the total USD volume executed within ±2, ±3, and ±5 basis points of the VWAP mid price per 5-minute bucket, aggregated as the median across all overlap-hour buckets. As noted above, this reflects executed volume within the band, not resting quoted depth. CME and Hyperliquid depth are likely understated by this method.
Slippage: Execution slippage is estimated using a fills-sorted synthetic order book. Within each 5-minute bucket, observed taker fills are sorted by price (ascending, to simulate walking the ask side) and walked sequentially until the target order size is filled. The arrival price is set as the lowest-priced fill in the bucket (a proxy for the best ask at order arrival). Slippage is then computed as the difference between the execution VWAP and the arrival price, expressed in basis points. This is applied at incremental order sizes from $10k to $1 million.
HL-CME Basis During Overlap Hours: The signed price differential between the Hyperliquid mid and the CME last price is tracked across all overlap-hour 5-minute windows. This captures any structural premium or discount at which Hyperliquid trades relative to the CME reference price during active hours. The Hyperliquid mid price is derived from the VWAP of taker fills per 5-minute bucket, not from a live order book quote.
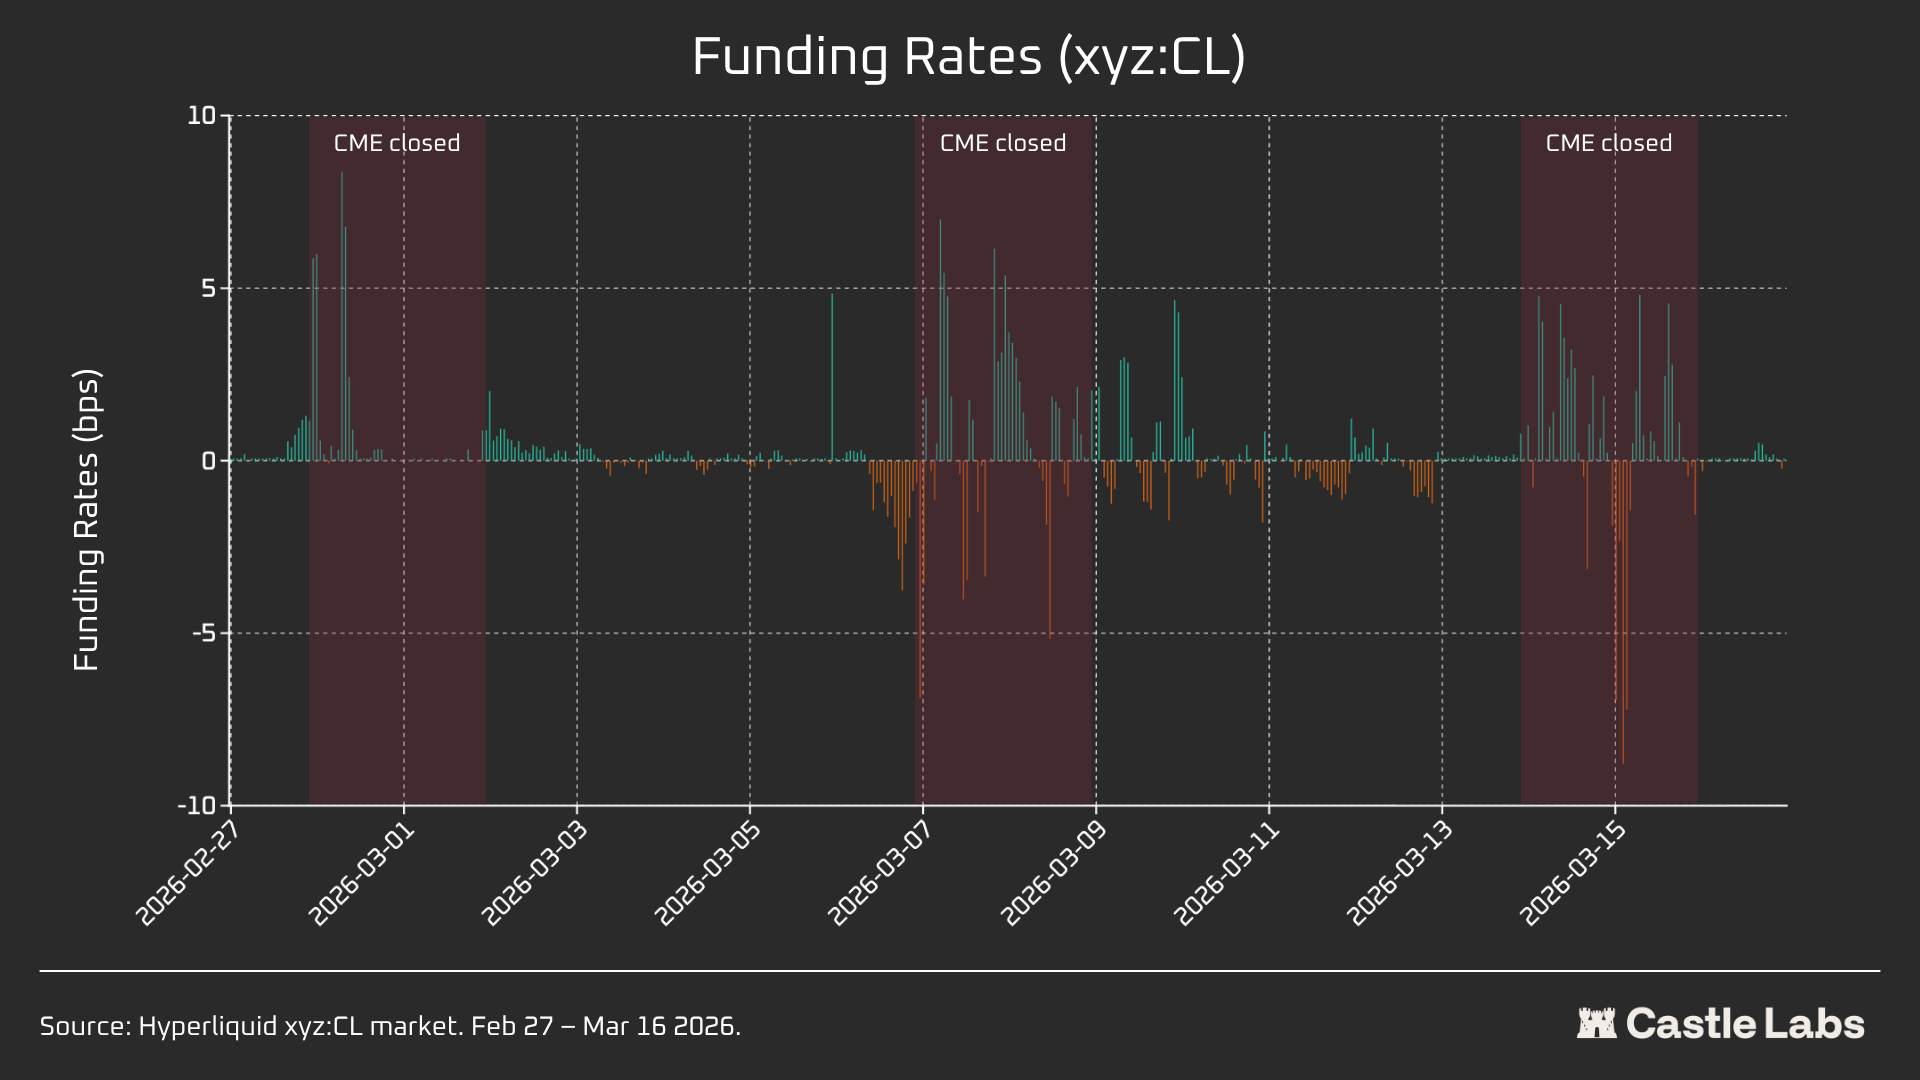
Flows and Funding: Hyperliquid funding rates are reported at hourly resolution (HL settles funding every 1 hour). Funding rates are expressed in basis points per 1-hour period.
Weekend Analysis
This analysis focuses on three discrete CME-closed weekend windows:
W1: February 28 - March 1, 2026
W2: March 7 - March 8, 2026
W3: March 14 - March 15, 2026
A structural note on Weekends 1 and 2: Hyperliquid perpetuals are constrained so that
the mark price cannot deviate beyond the “discovery bounds” (DB). When the oracle price freezes, as it does when the primary reference market (CME) is closed, and external price feeds stop updating, the protocol effectively caps the executable price within a tight band.
Price Discovery: For each weekend window, we report Hyperliquid xyz:CL key data metrics, including the price, volume, and number of trades.
Monday Open Price-Gap Deviation: For each weekend, we measure the price gap between Hyperliquid and CME at three reference points:
3h before CME reopen
1h before CME reopen
At CME open (T=0)
All gaps are expressed in basis points. Positive values indicate Hyperliquid was above the CME open, negative values indicate a discount.
Quantitative Analysis
We begin this section with our first analysis, comparing Hyperliquid xyz:CL HIP-3 oil market with NYMEX CLJ6 on weekdays during overlapping hours.
Liquidity Depth
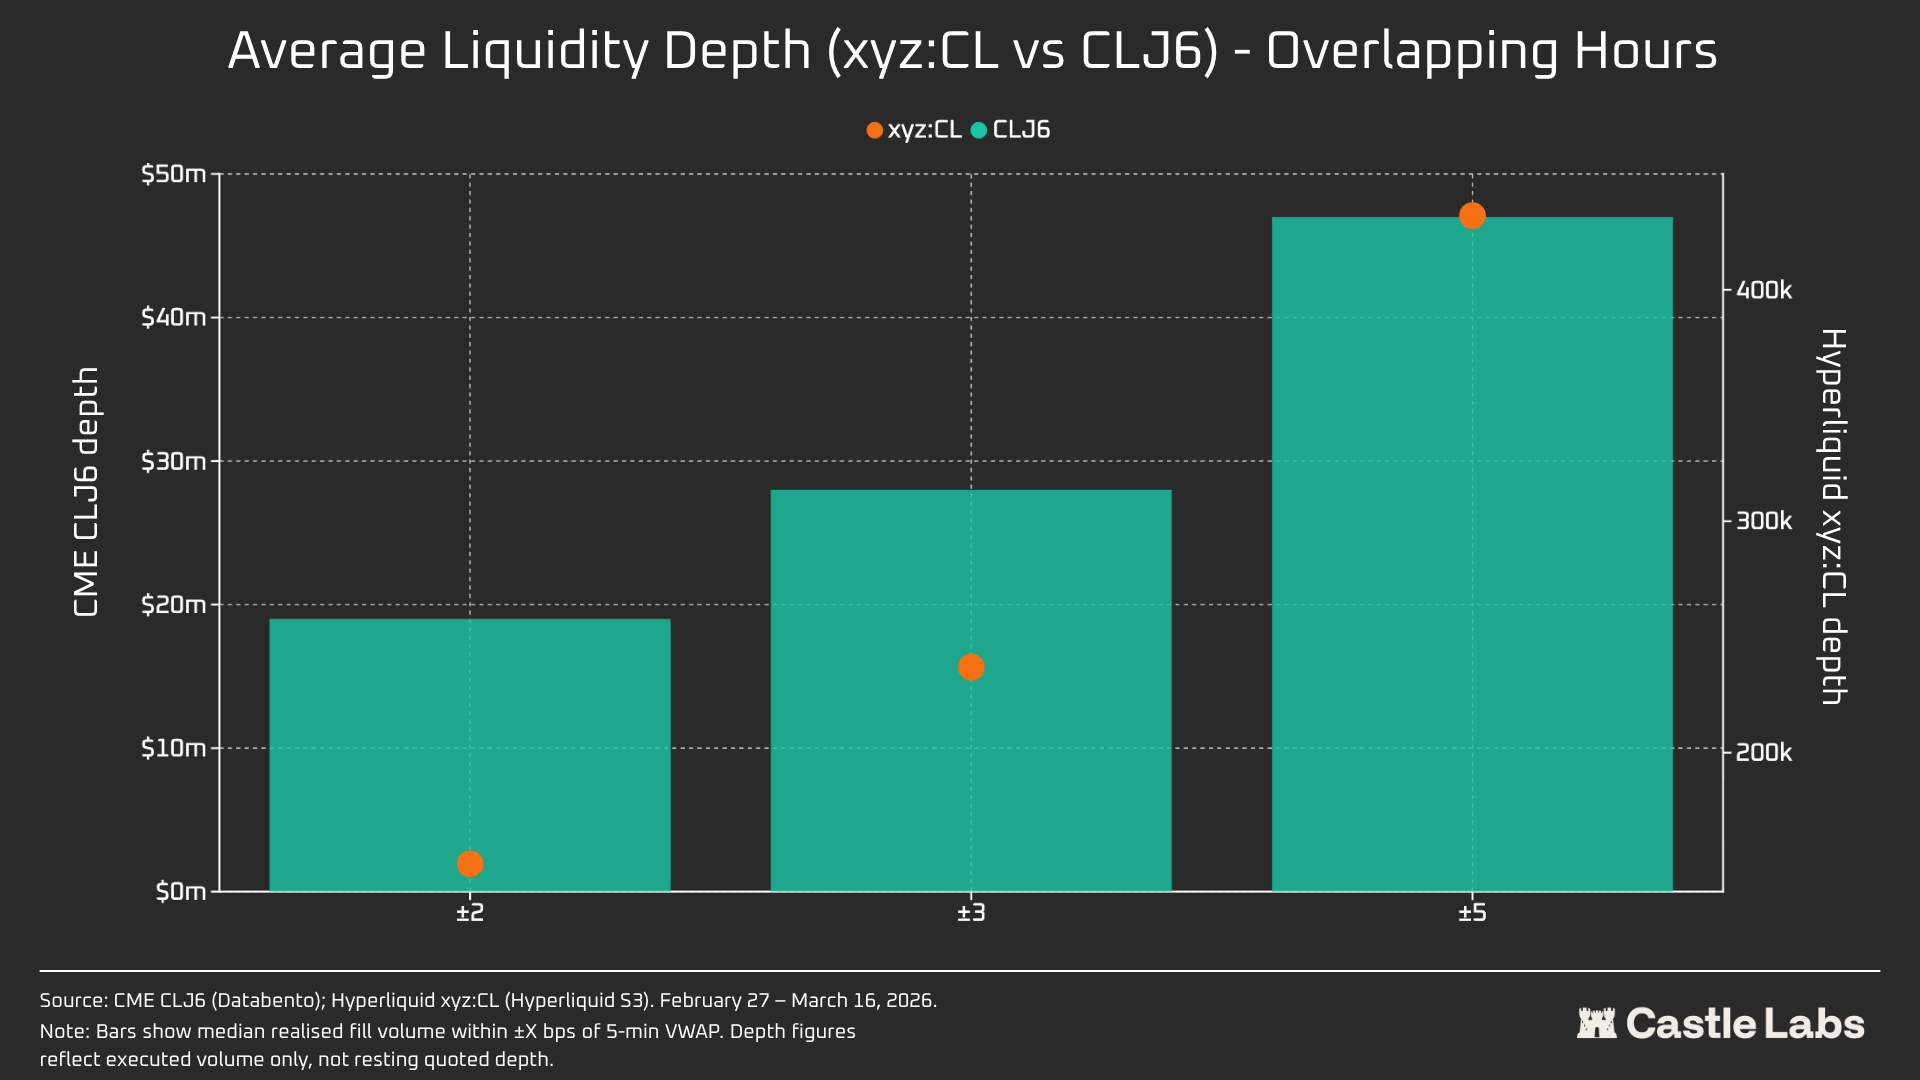
There is no doubt that onchain commodity venues have a completely different liquidity profile compared to the CME. The average liquidity depth of CL on HL is less than 1% of that of CLJ6, with scaling consistent across bands (109x at ±5 bps). At ±2 bps from mid, CME offers $19M in executable depth versus $152K on Hyperliquid: a 125× difference.
This is no surprise, considering the novelty of the CL market on HL as well as the different user targeted. The primary value proposition of onchain venues was permissionless access for those traditionally excluded by incumbents, such as the CME.
However, as venues such as HL become more important on weekends, we are witnessing a shift in the perception of these platforms, with growing interest from institutions in hedging their positions during off-market hours. Therefore, it becomes increasingly important to nurture market conditions that make markets such as CL suitable for traditional investors and retail alike.
For a retail trader executing $10K, this gap is irrelevant.
For an institutional desk moving $1M+, onchain trading of CL (and most other markets) remains prohibitive.
The inherent differences in user profiles are, in fact, reflected in the median trade size for these markets during overlapping hours.
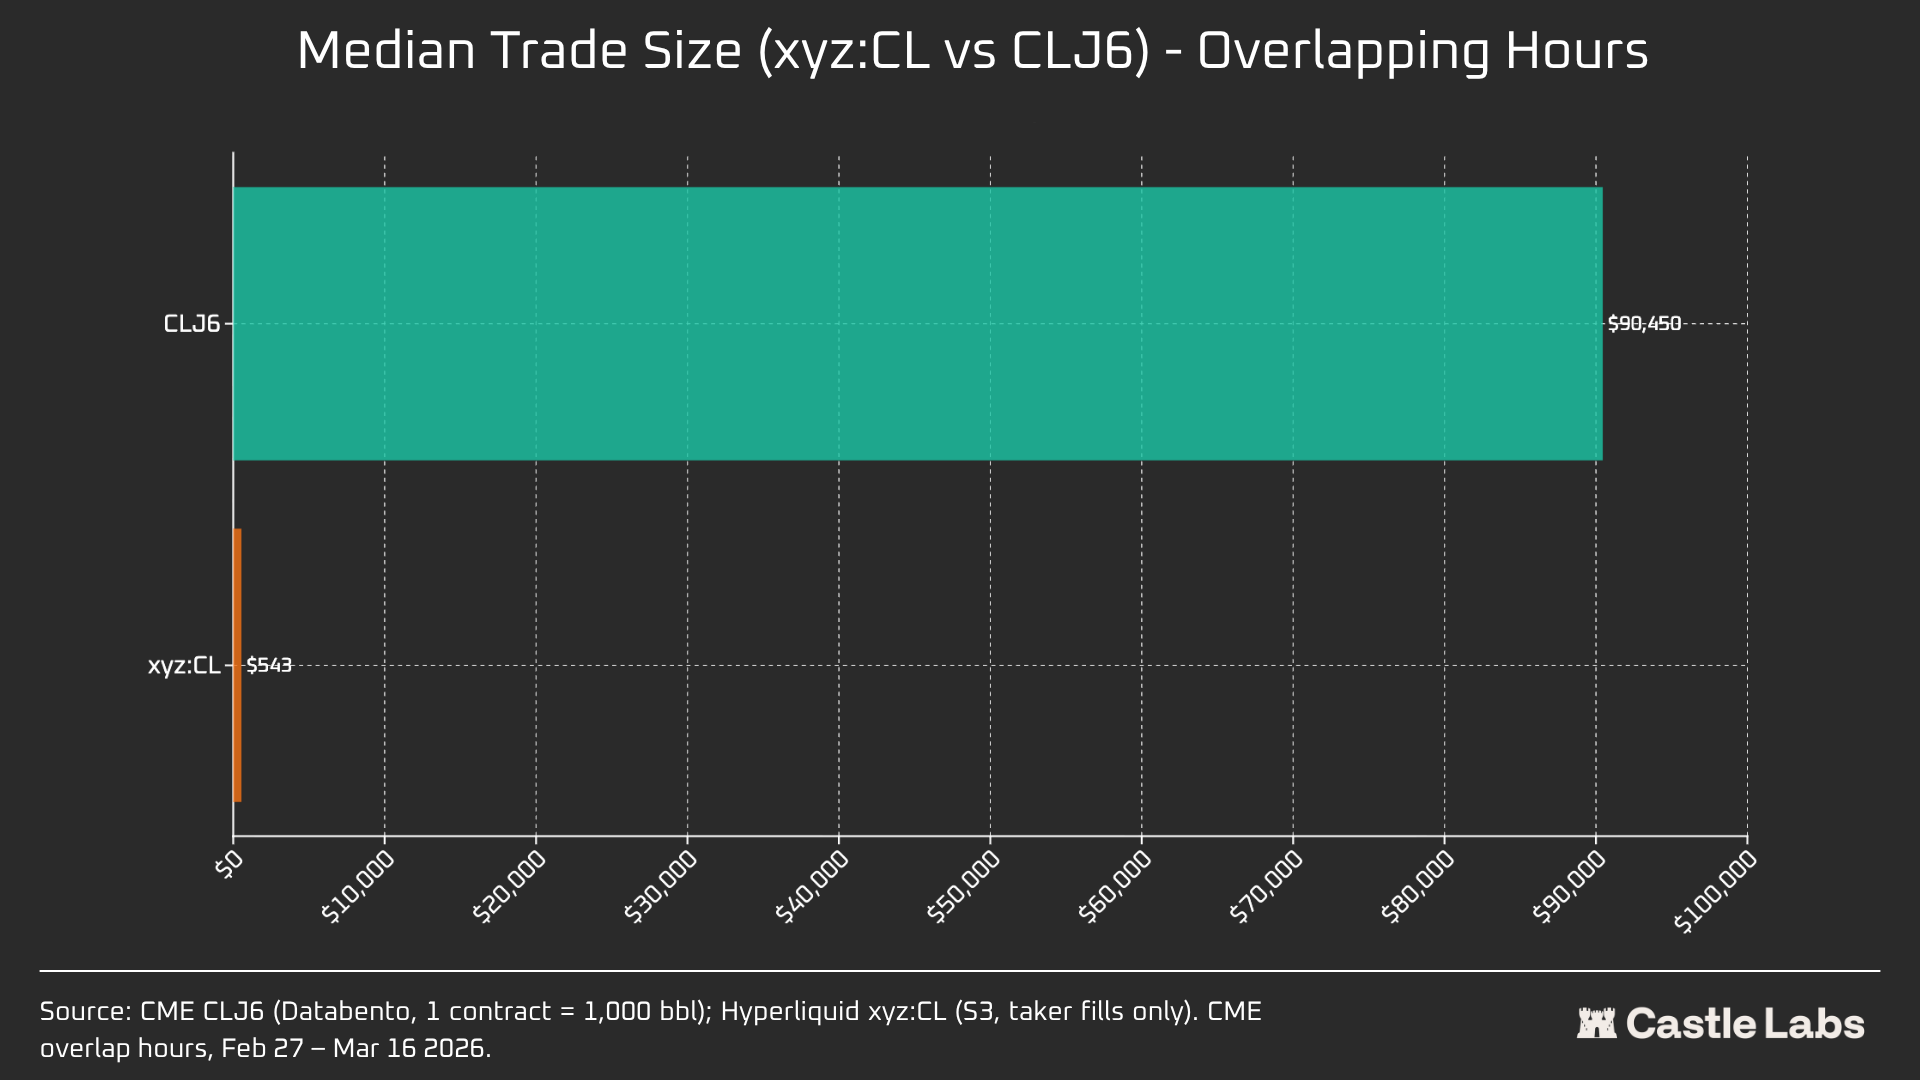
The 166× difference in median trade size ($90,450 vs $543) is the clearest proof that these venues serve fundamentally different user profiles. The median size on CLJ6 aligns with one standard crude oil futures contract (~$94k notional at current prices), while Hyperliquid’s $543 median reflects crypto-native retail traders taking leveraged directional bets.
We expect the HL median trade size for commodity markets to hit an inflexion point as these markets become increasingly legitimised in the eyes of more traditional investors, bringing their funds onchain.
To further differentiate across trade sizes, we run order simulations capped at different sizes from $10k to $1 million.
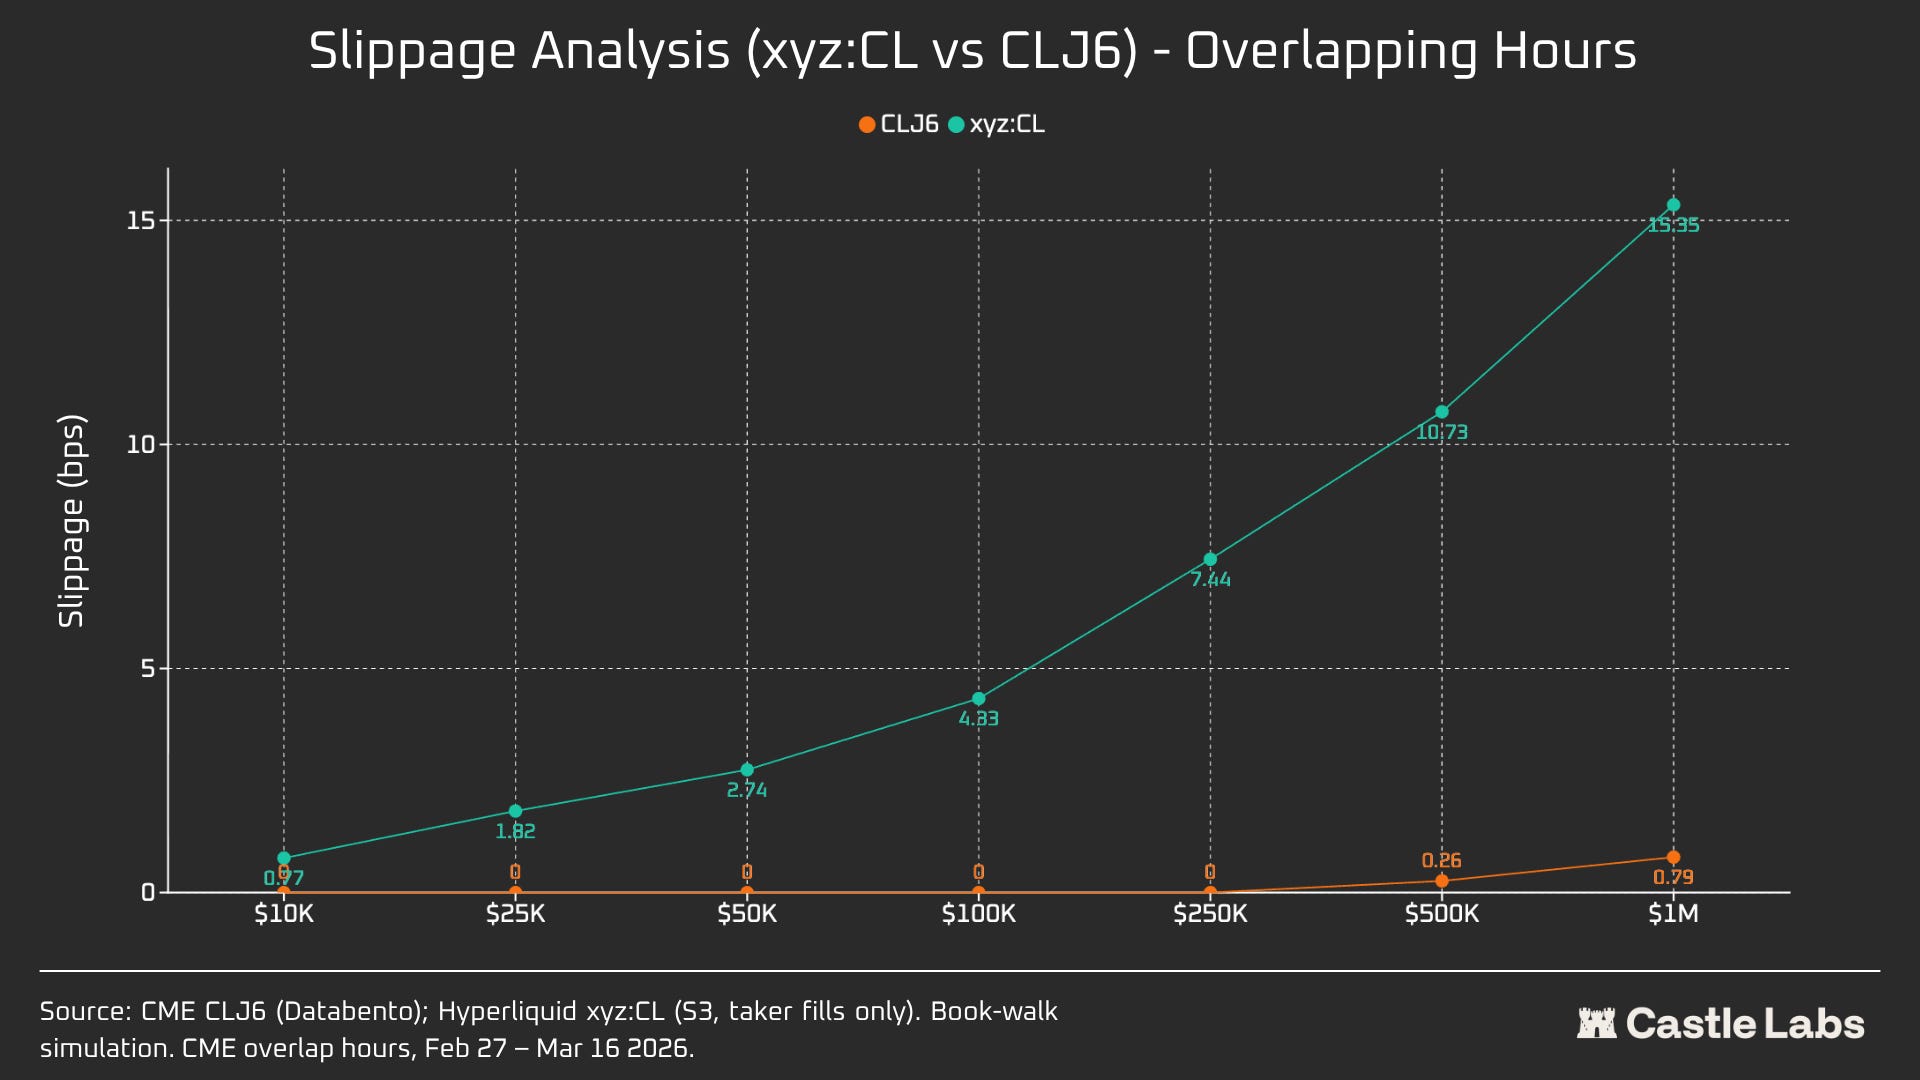
For $10k orders, the CLJ6 traders have no slippage, as expected, whereas HL users incur a sub-1 bps median execution slippage of 0.77 bps. The inflexion points occur at a $100k order, where HL users’ slippage rises to 4.33 bps, approaching the 5 bps threshold, while there is no slippage on the CME CLJ6.
It is worth noting that this is above the median trade size for the CLJ6 market ($90.450k).
At $1M, Hyperliquid’s 15.4 bps is ~20x CME’s 0.79 bps, confirming that the venue is not yet viable for institutional-sized orders. Given the average trade size on HL, the platform can serve its users just as well without slippage.
CLJ6 orders begin to experience material slippage, affecting their execution at sizes around $500k.
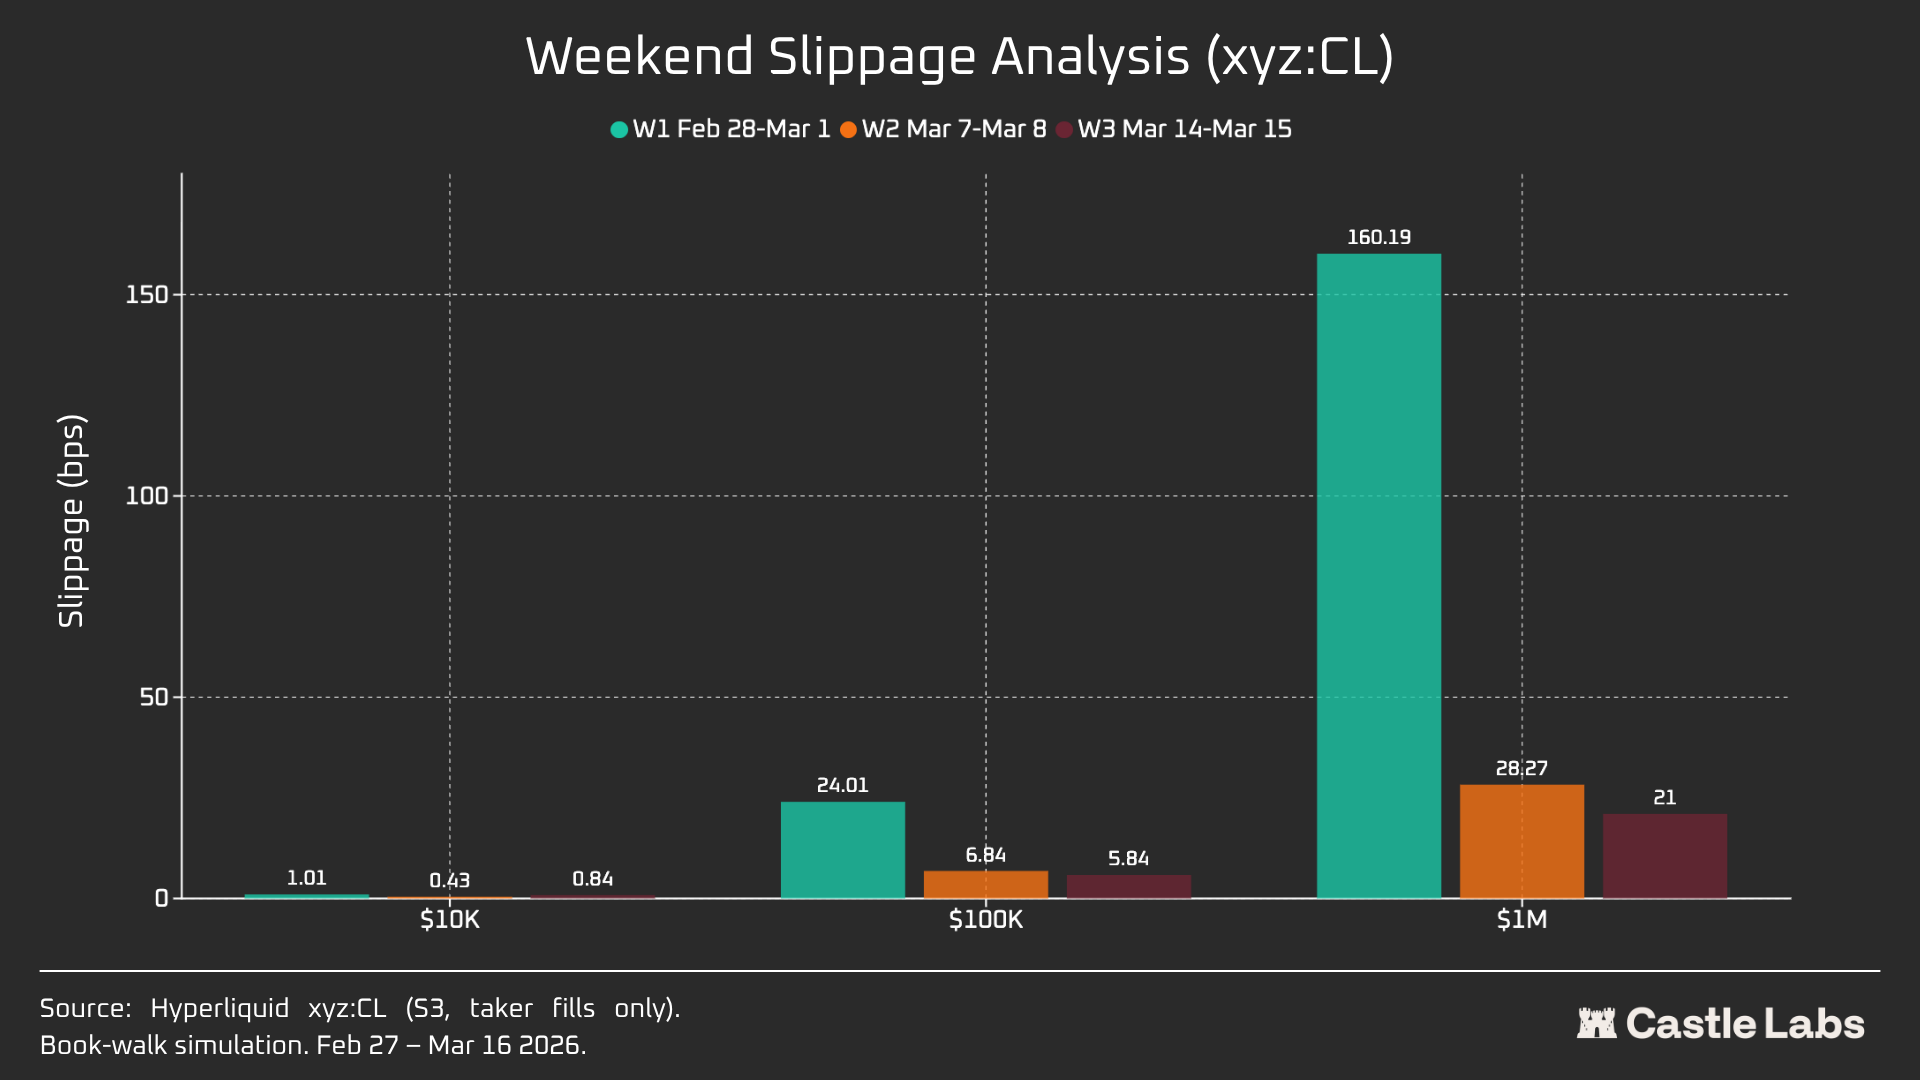
When we extend our order-size analysis to weekends, slippage declines across all order sizes, especially for the $100k and $1 million order sizes, indicating market maturity.
Over the course of the three weeks analysed, slippage has gone down as follows, for these simulated orders:
$10k: -16%
$100k: -75%
$1 million: -86.9%
Funding Rates
Funding Rates of CL were volatile during the CME close hours but less dynamic during the overlapping hours. This helps us reveal the market’s internal pricing dynamics when it operates outside market hours.
Being open on the weekends means the CL market leverages internal price discovery (supported by DB and other mechanisms of risk reduction). As such, funding rates are expected to be more volatile, as observed during the highlighted periods below.
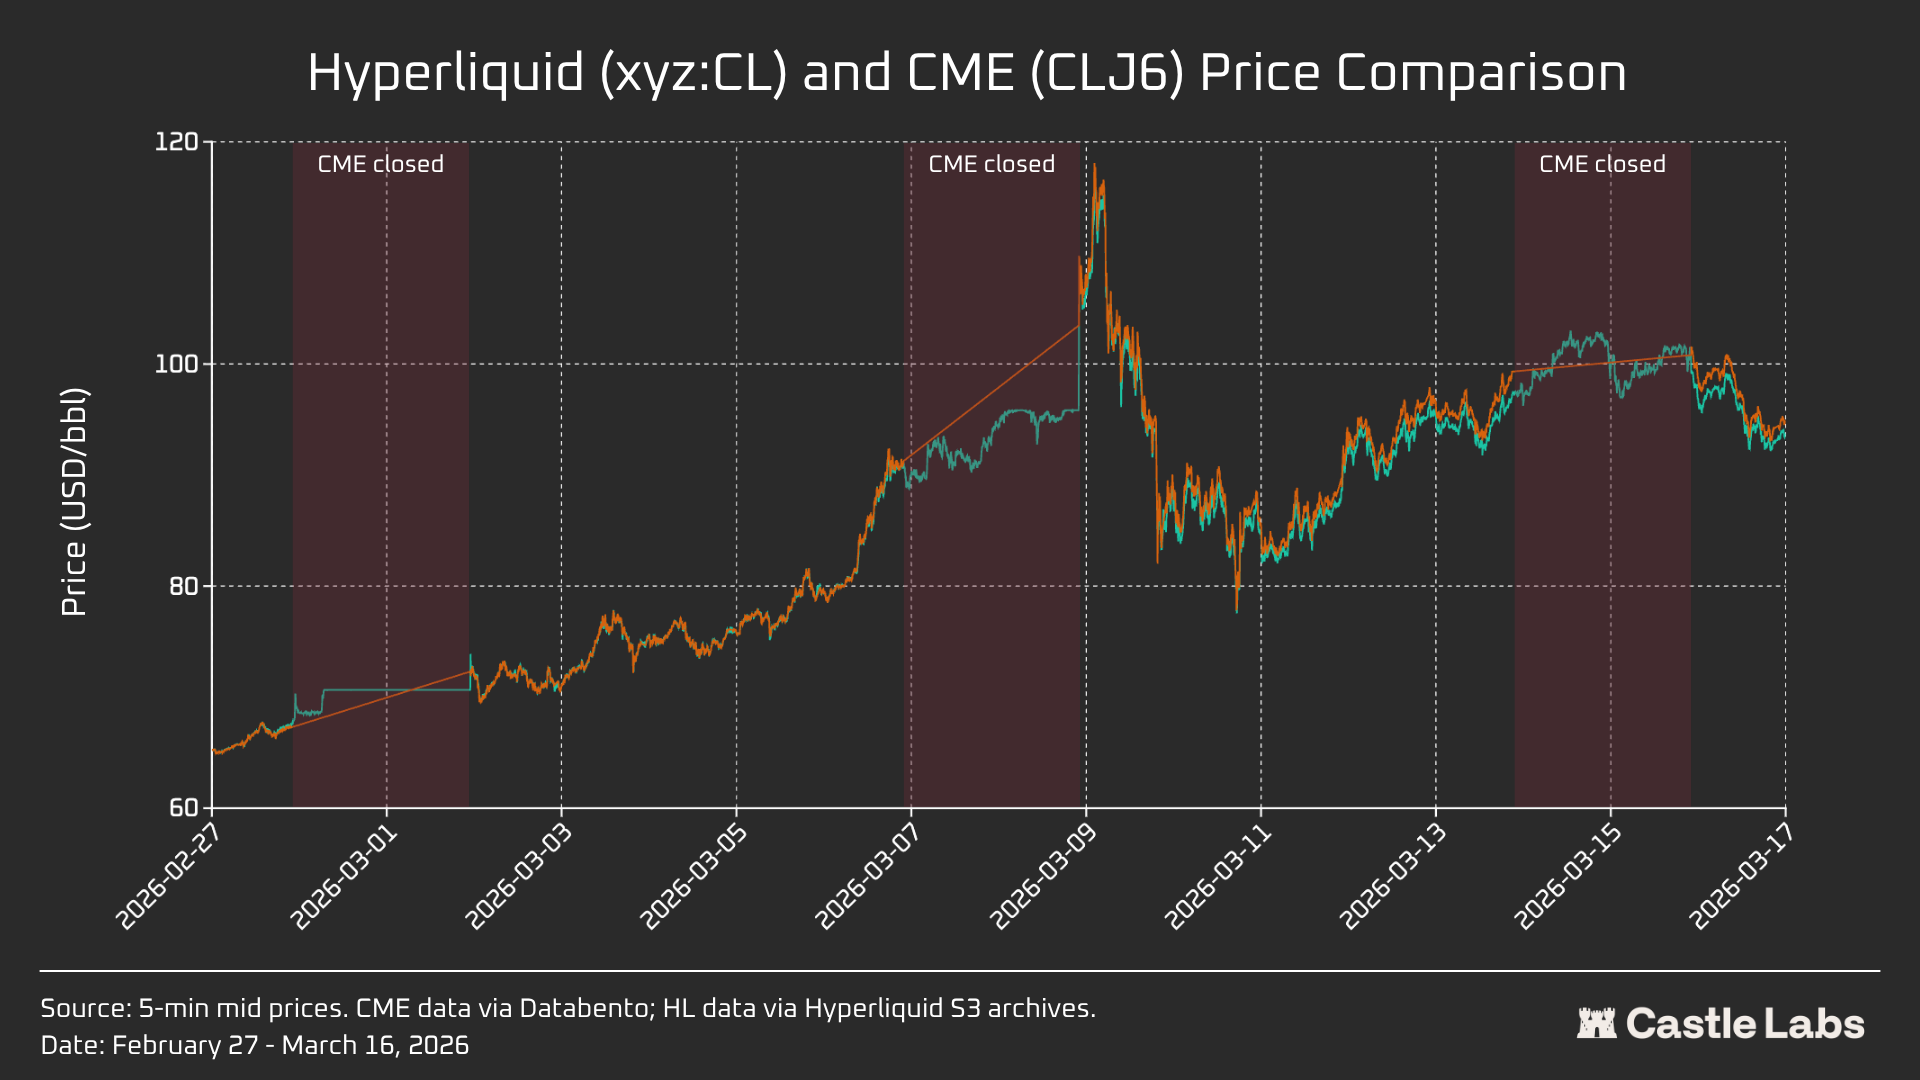
During active trading hours, Hyperliquid’s xyz:CL tracks CME’s CLJ6 closely, though a structural discount emerged and widened as oil prices rose, most likely driven by the funding rate pressure from accumulated long positioning. During weekend hours, when CME is closed, Hyperliquid’s price discovery is further constrained by the price band mechanism (DB), which limits how far the mark price can move in the absence of a live reference market.
Weekend Analysis
The three weekends tell a story of rapid maturation:
Weekend 1 (Iran strikes)
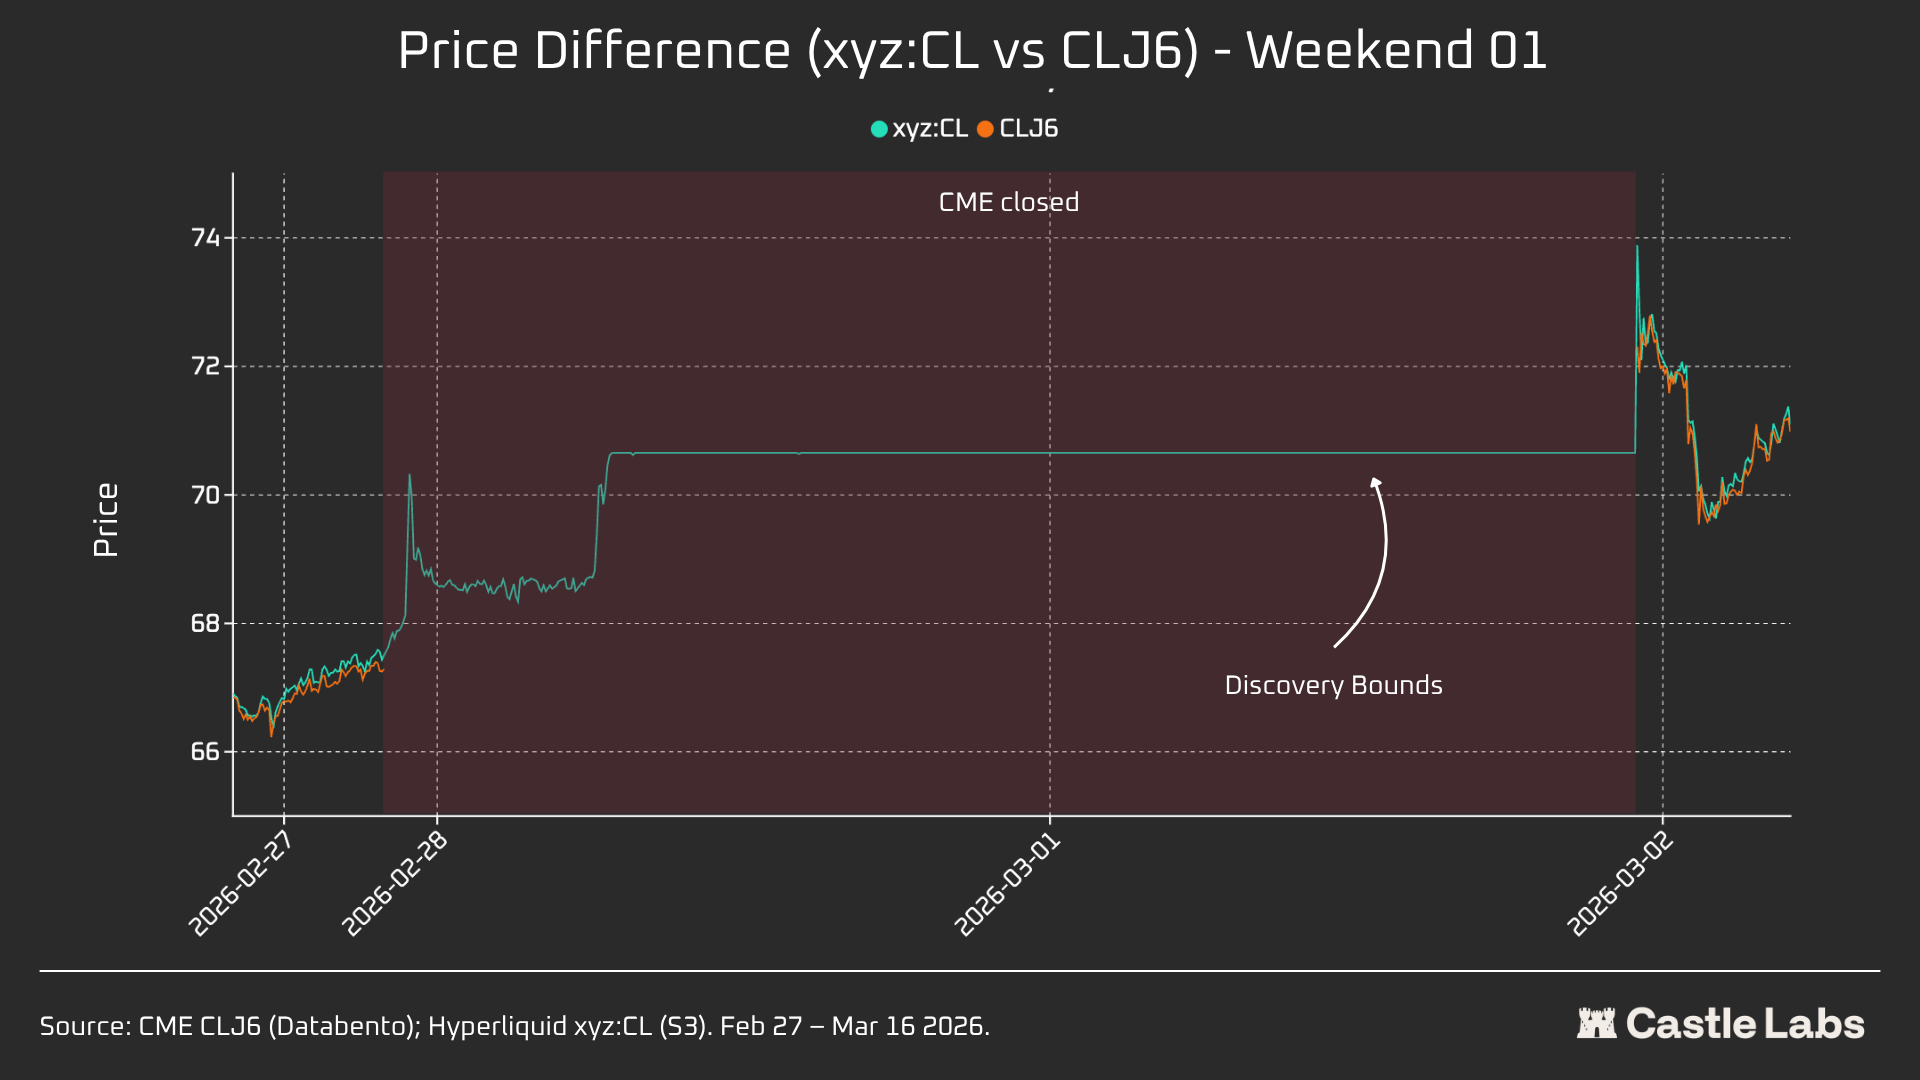
Hyperliquid moved from CME’s $67.29 close to ~$70.80, capturing roughly 45% of the eventual Monday gap to $75 (+1146 bps).
An important caveat this weekend is that, due to the ±5% DB of Tradexyz mentioned above, price discovery was capped. This explains why the line in the chart is flat and why there is a Monday gap. Nonetheless, Hyperliquid xyz:CL($73.89) was within 1.5% of CME CLJ6 ($75) at the first second of paired data.
This is not a “miss” or “failure,” but rather risk protection through market design.
For this reason, weekend 1 is the least relevant from a data perspective, but it highlights how the xyz:CL reacted to the initial shock of the strikes on Iran, as well as the importance of DB as a mechanism to cap price discovery during weekends, especially for new markets.
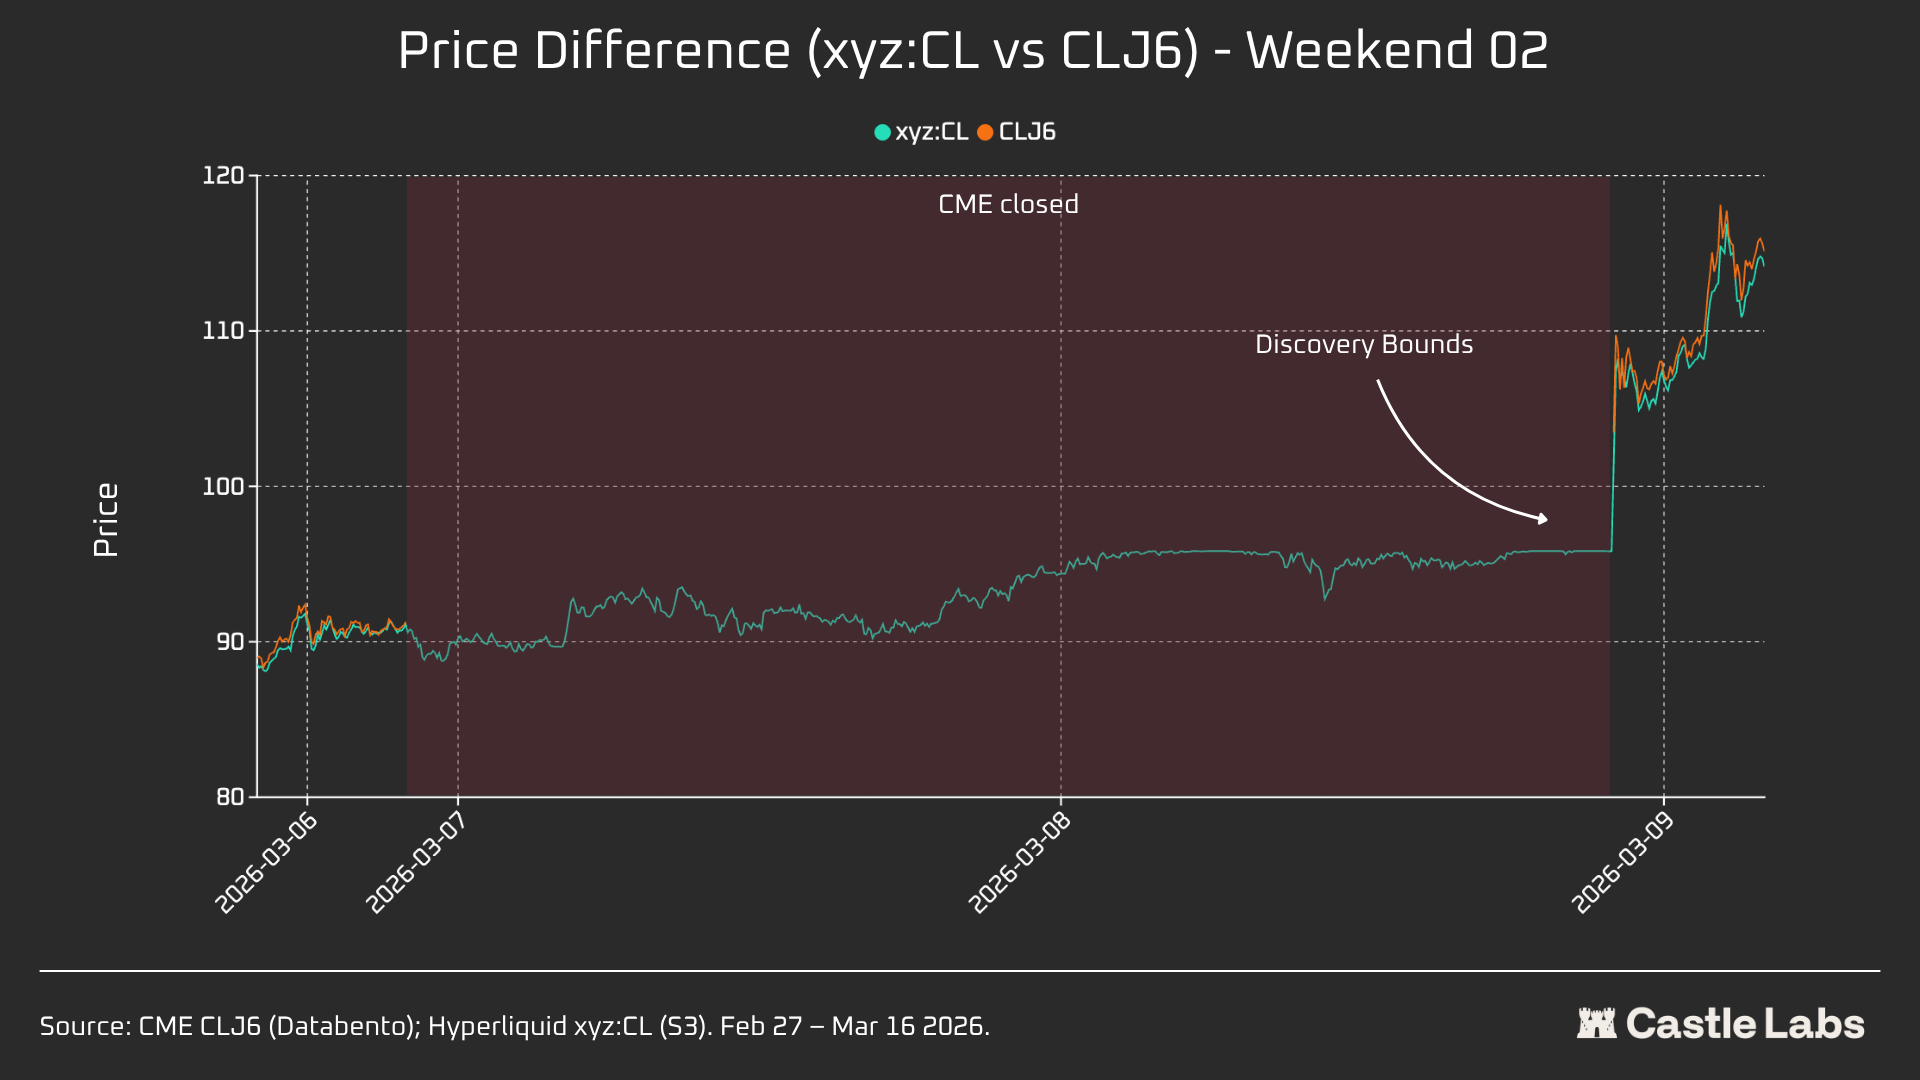
Weekend 2
Weekend 2 was the real test as xyz:CL hit the DB at the very end of the market. CLJ6 opened at $98 (+737 bps from $91.27 close), while xyz:CL reached ~$95.83, capturing only 68% of the move.
In Weekend 2, xyz:CL was able to better capture the move and was closer to the CME open than the preceding weekend.
Weekend 3
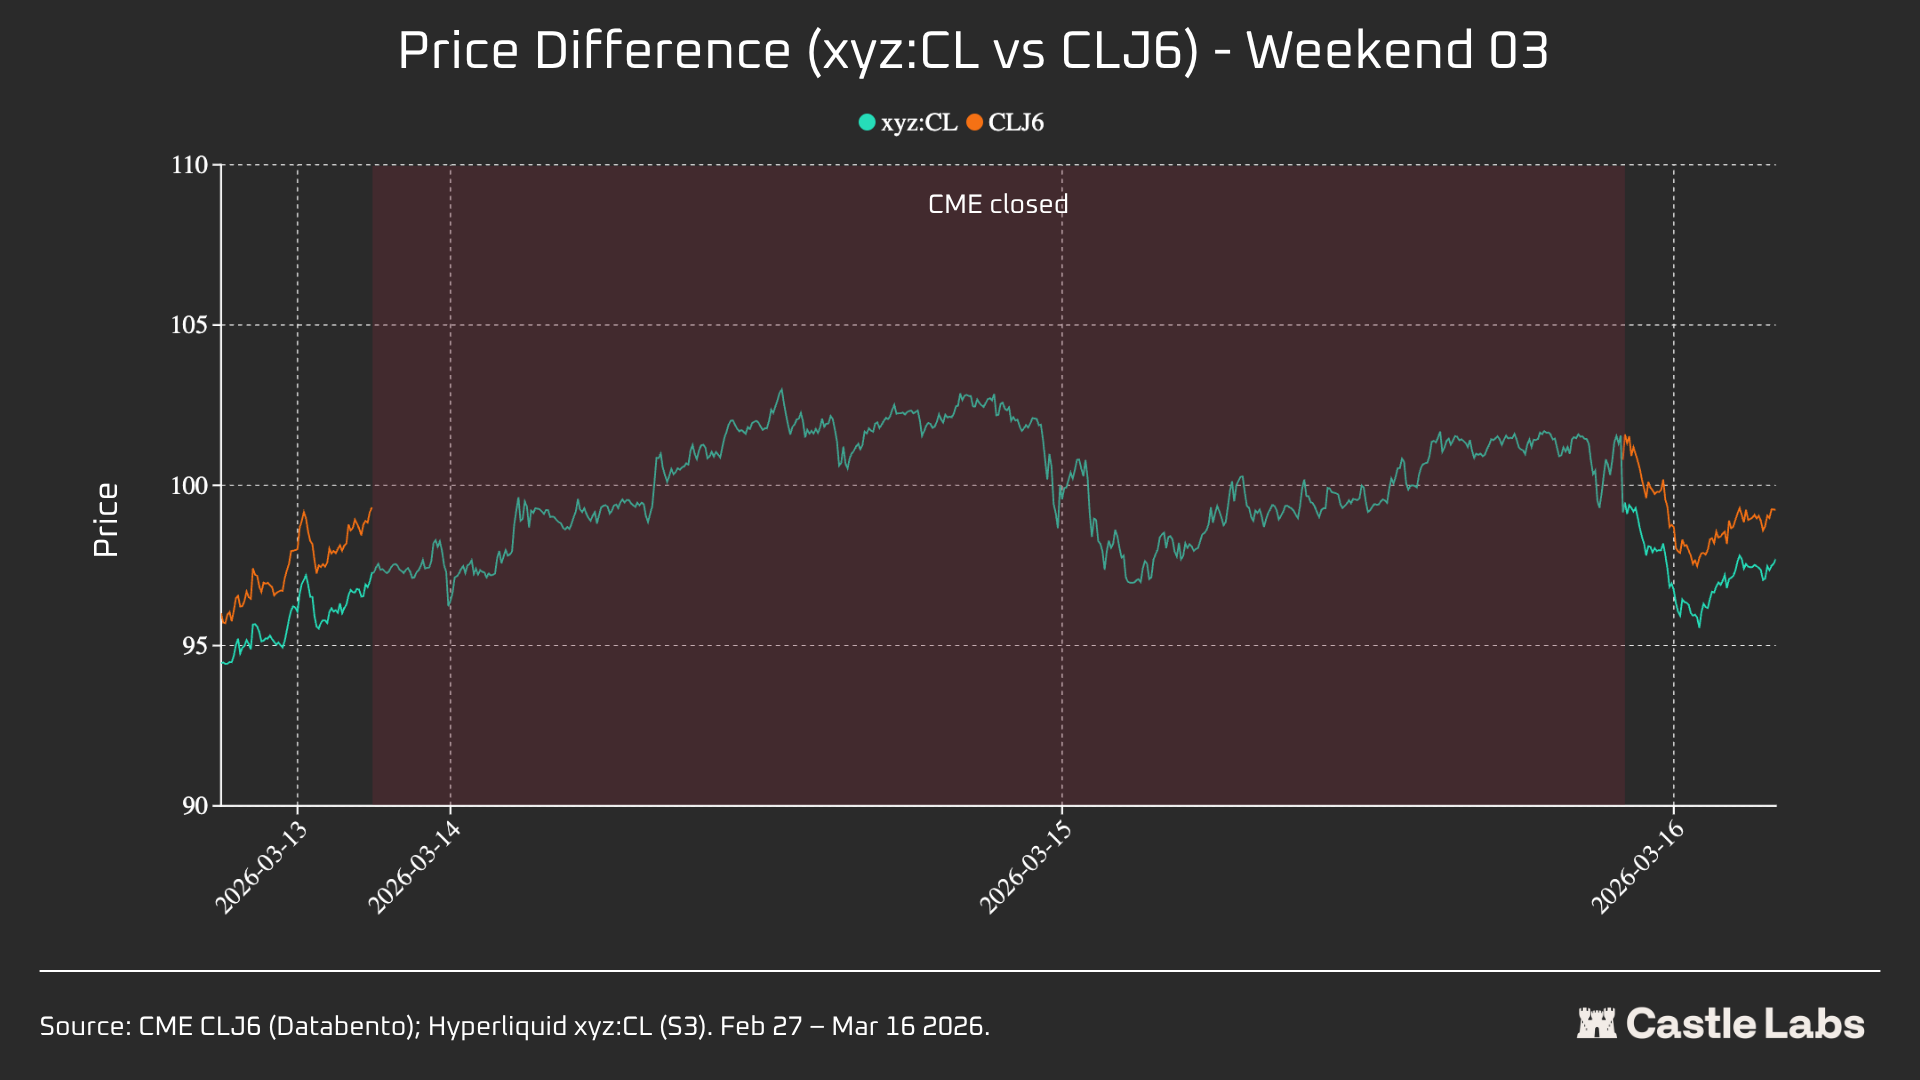
Weekend 3 highlights that, in calmer conditions, Hyperliquid can more reliably predict the eventual CME opening directionally.
This weekend highlights xyz:CL tightest convergence with CLJ6: At +226 bps vs CME close, it slightly overshot the Monday open of +62 bps. CLJ6 closed at $99.31 at Friday and opened at $100.93 (+163 bps) while xyz:CL at the CME open was trading at $101.56.
Taken together, the three snapshots show a structural change in the xyz:CL market on Hyperliquid, transitioning from an infant market constrained in price discovery by DB (Weekend 1 and Weekend 2) to increasingly free price discovery with overshoot and correction (Weekend 3).
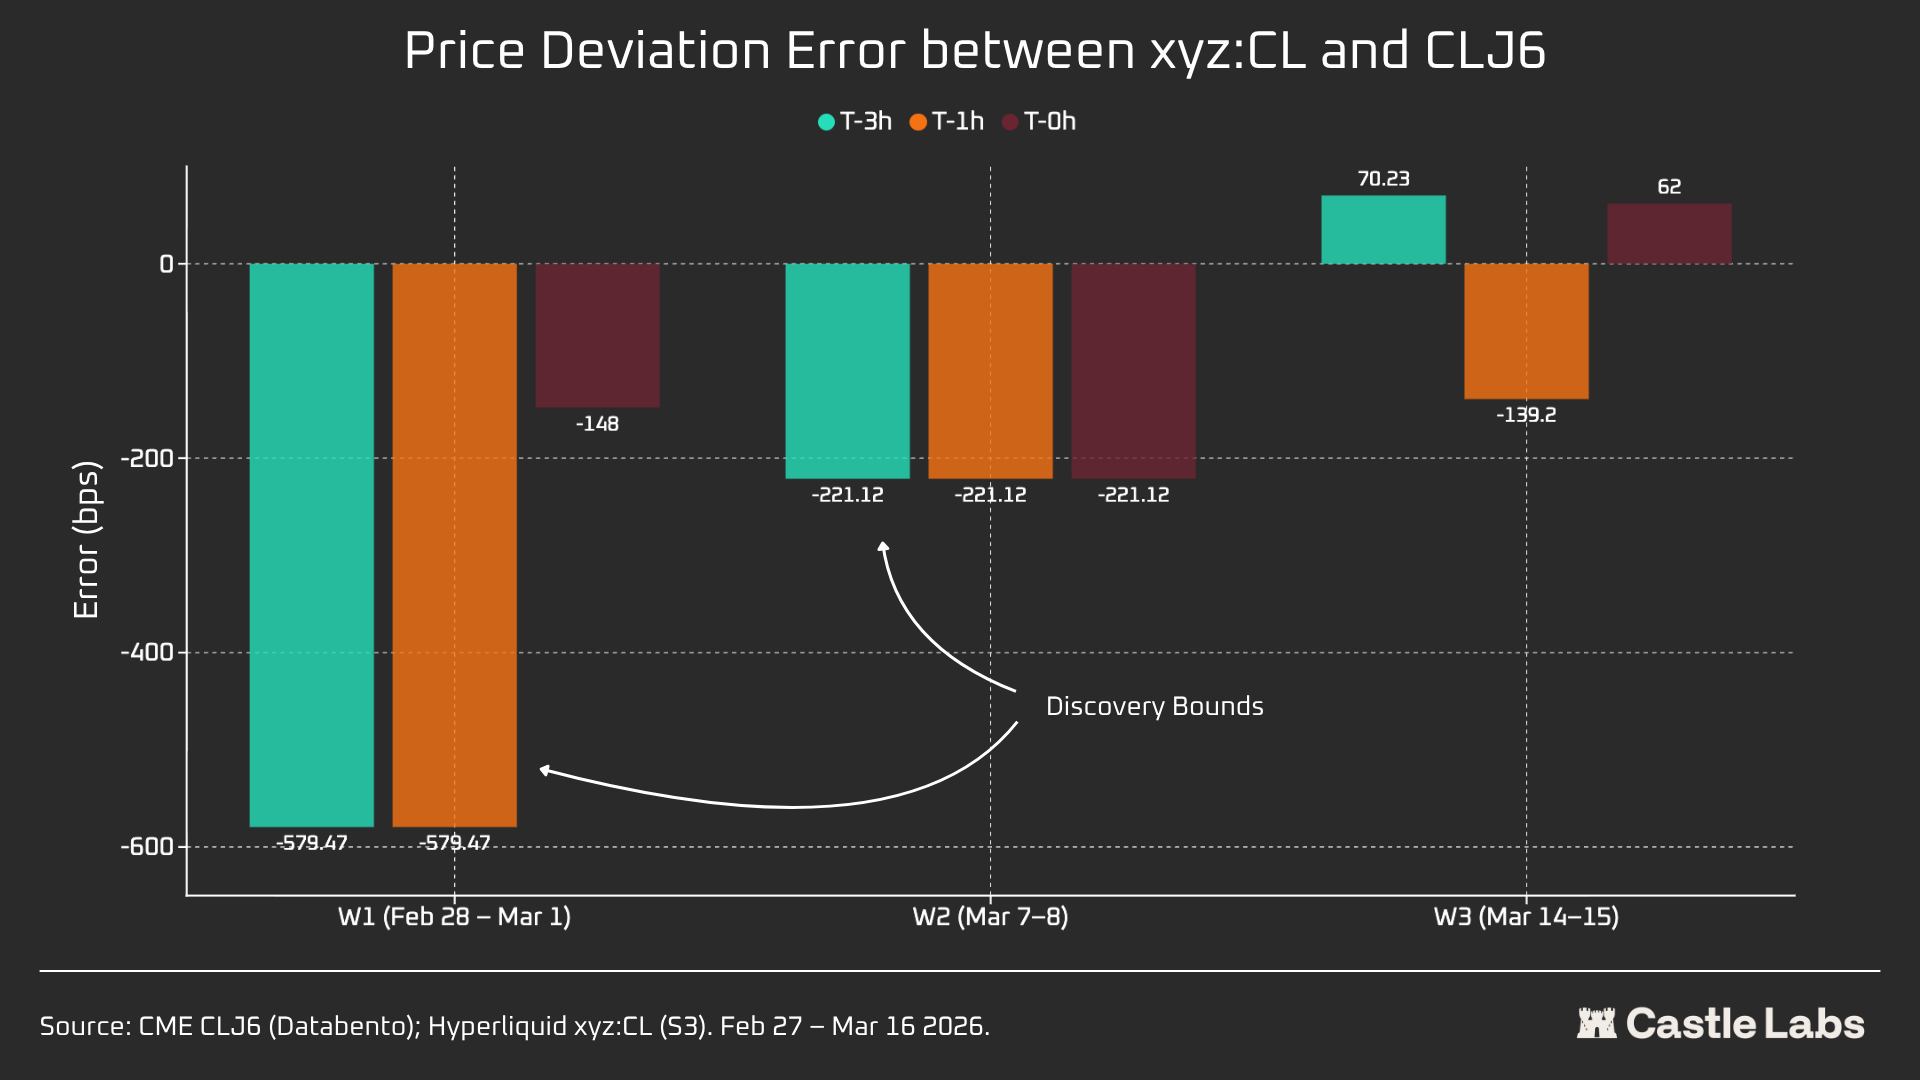
Upon analysing the price-deviation error at different weekends for different hours before CME open (3h, 1h, 0h), weekend 3 shows the most reliable data, as in the initial two weekends the xyz:CL market hit DB. At weekend 3, xyz:CL was trading at an error of about +70 and -139 bps at 3 hours and 1 hour before the CME eventual open, indicating better price discovery than in the previously analysed weekends.
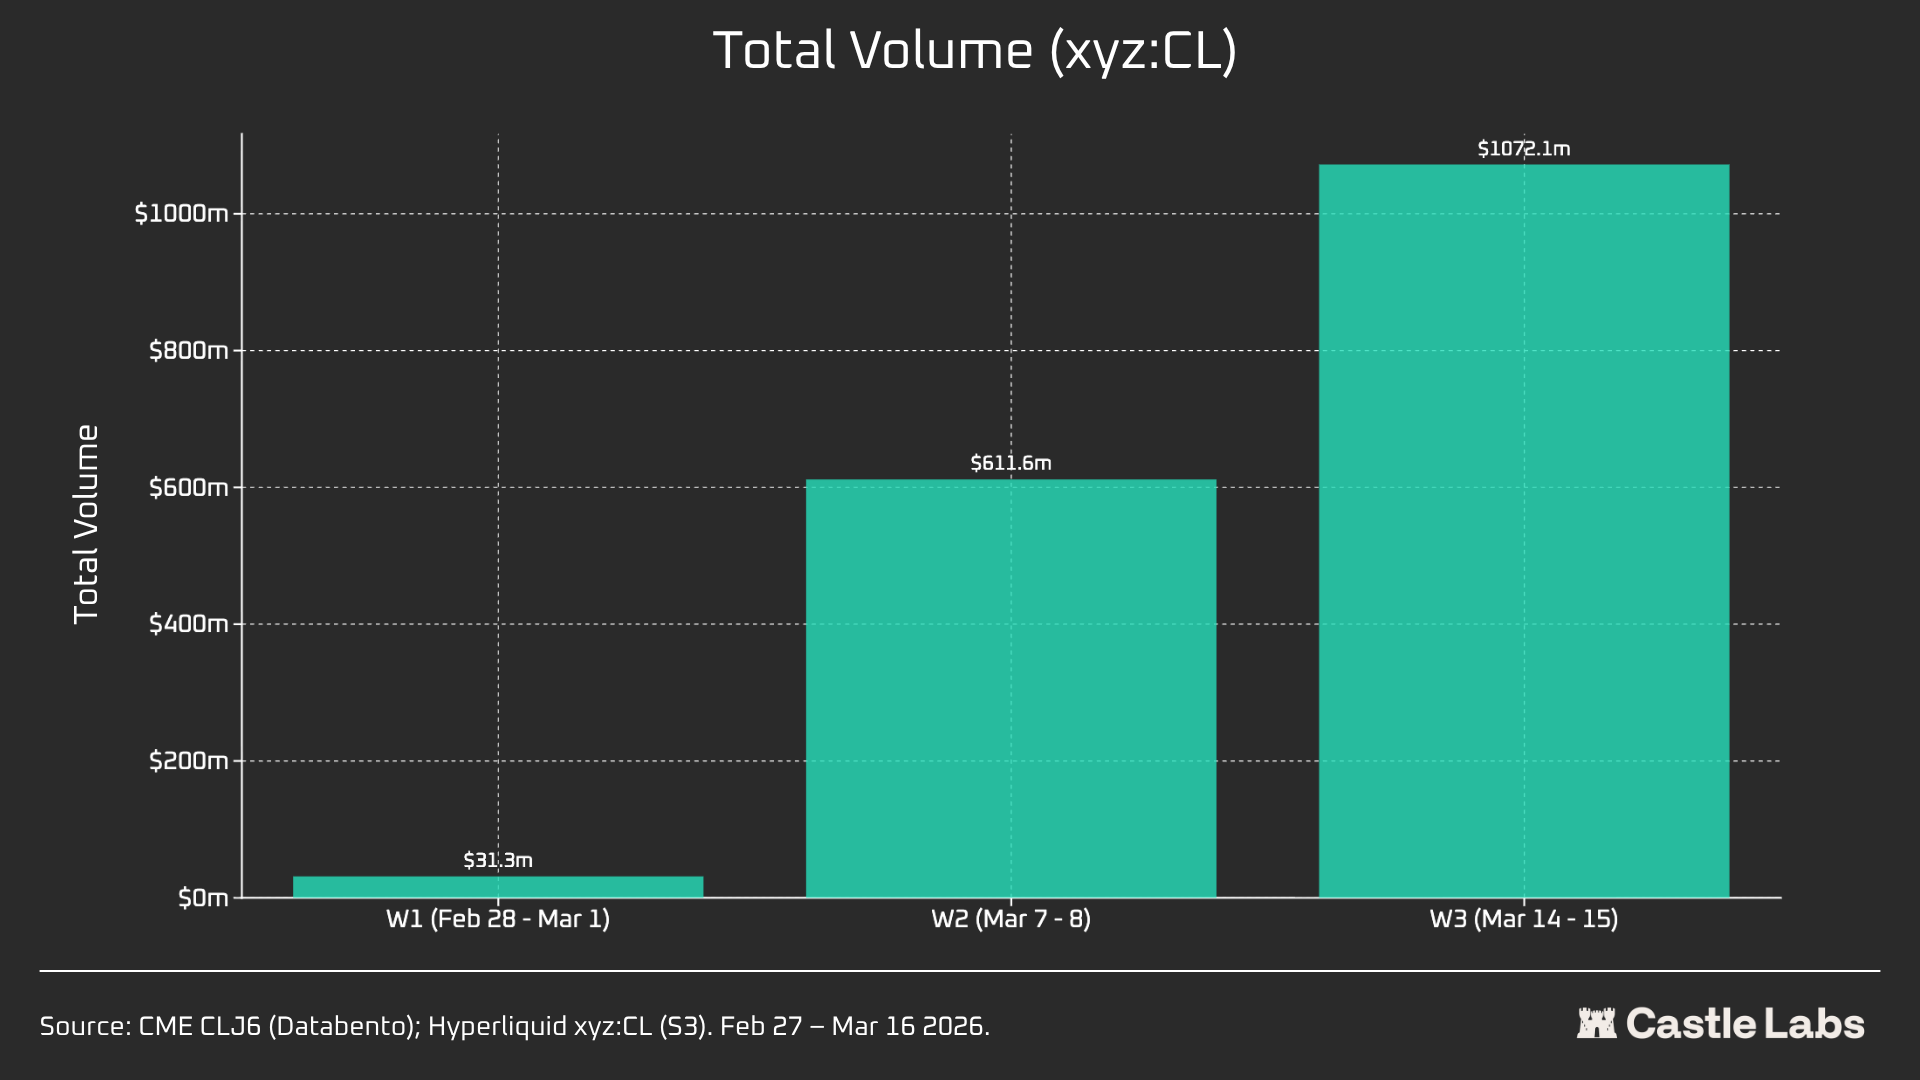
We also provide additional metrics for the weekend summary analysis, including volume, total trades, and average trade size, which varied across weekends and increased further over consecutive weekends.
The total volume in the xyz:CL market grew from $31 million to over $1 billion in three weeks, reflecting increased usage and eventual maturation.
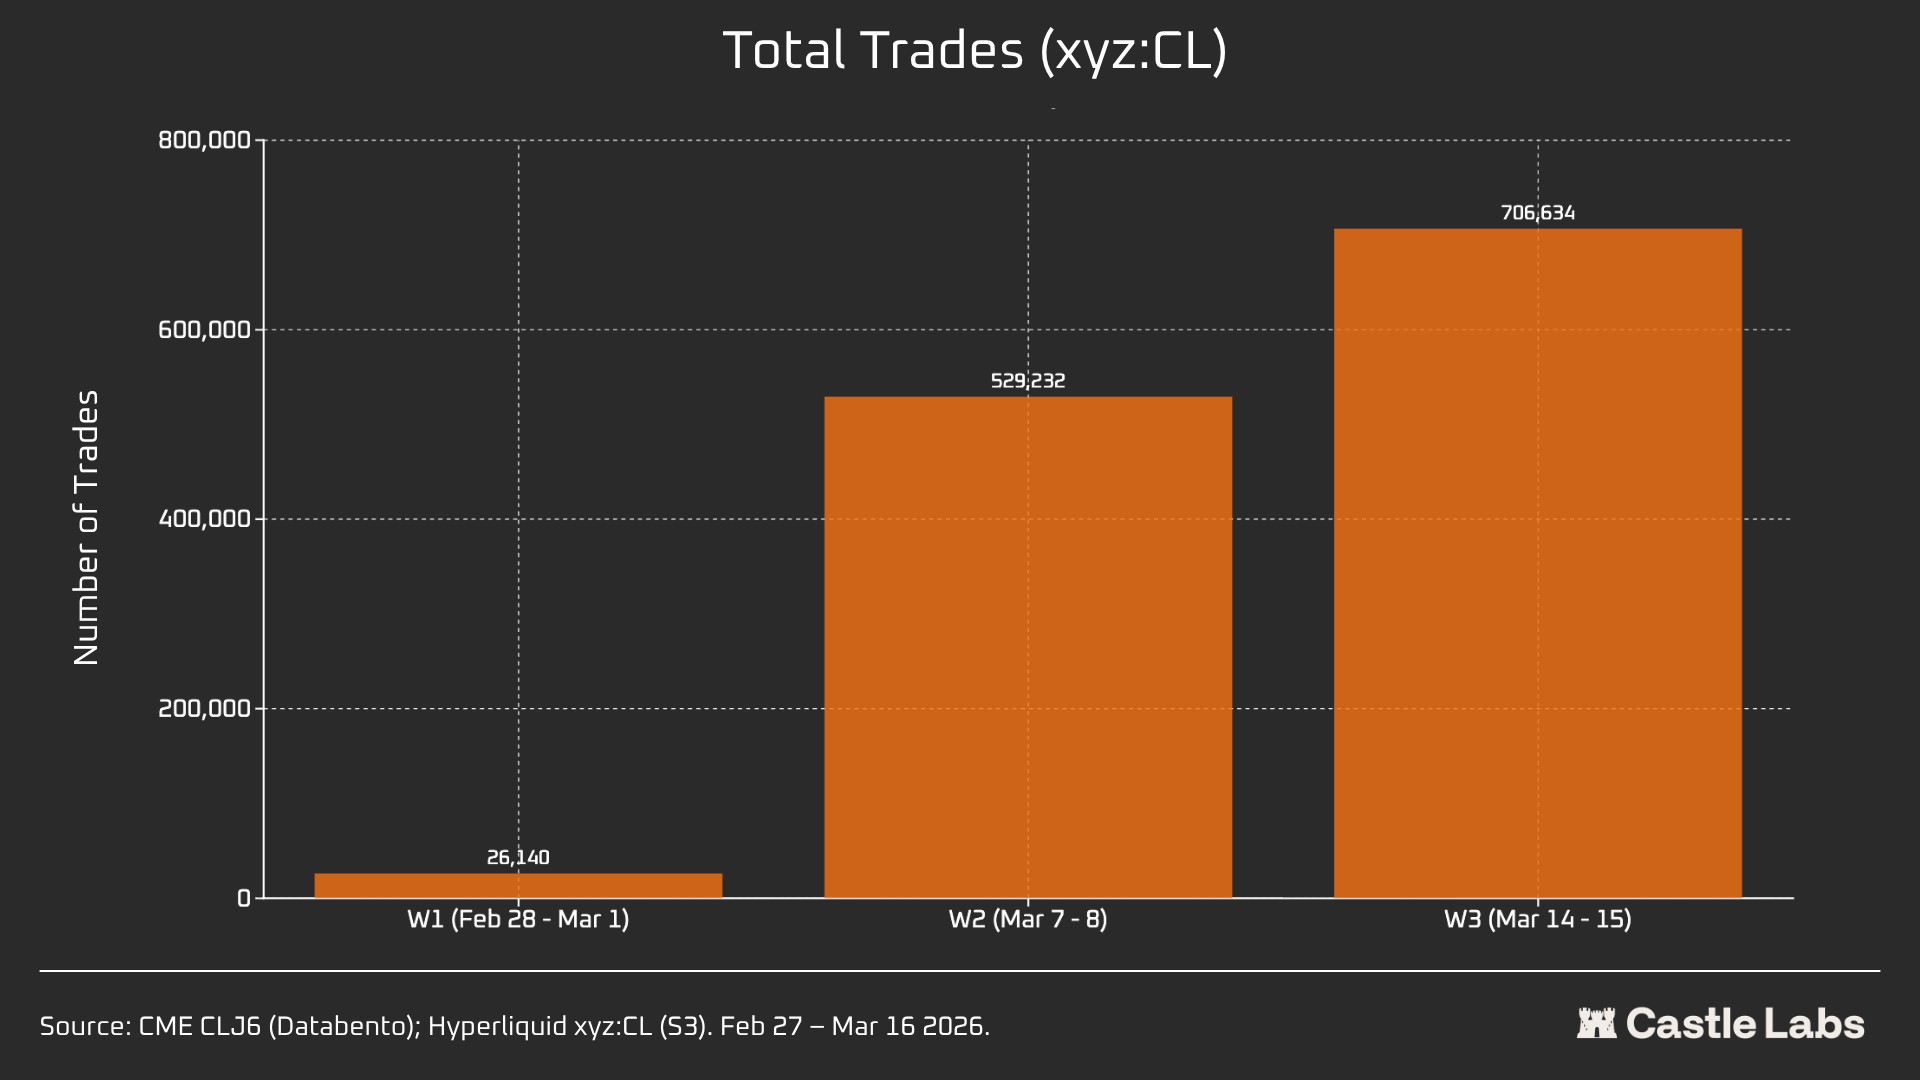
Additionally, the total number of trades followed increased from just 26k at weekend 1 to over 700k at weekend 3.
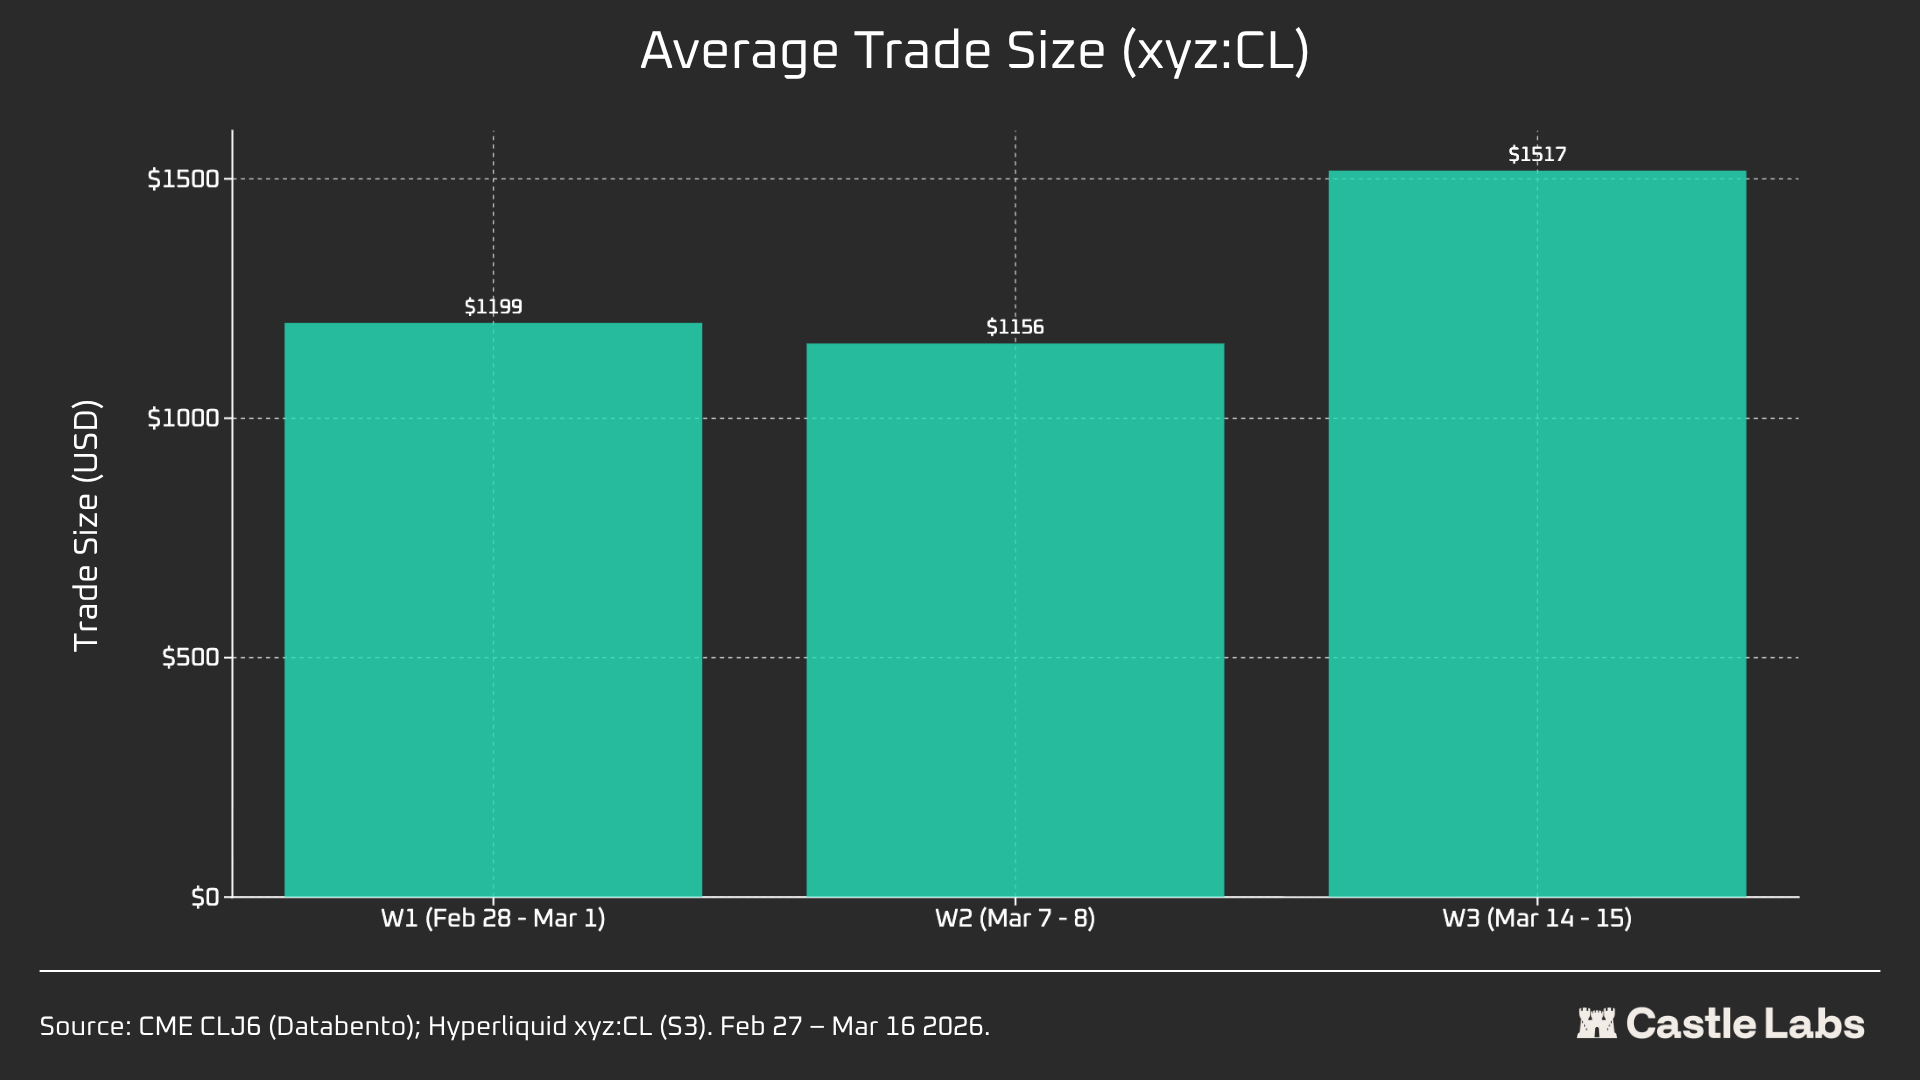
What’s interesting to note is that the average trading size on weekends actually increases from the median we highlighted earlier, to $534. The same growth trend is observed across all three weekends, possibly a sign that more institutional flows are being captured.
On the first weekend, the average size was $1199, rising to over $1500 by the third weekend.
This potentially indicates a different user base leveraging the platform on the weekend, less so retail users, and more traders who need oil exposure before Monday, making weekend flows closer to hedging demand than speculation.
Find the complete report here:
https://docsend.com/v/sjv2g/the_evolution_of_commodities
written by @noveleader and @francescoweb3 ✍️
Every week for the last 3 years, we have shared our research for free, directly in your email. Not a subscriber yet? Let’s fix it:

If you are more of a Telegram guy, you can read all of our research without the noise on our TG channel: