

Digital Asset Treasuries (DATs): How good of a play are they really?
DATs. DATs. DATs.

Introduction
Digital Asset Treasuries (DATs) have increasingly become a mechanism for attracting TradFi interest in blue-chip cryptocurrencies (such as BTC and ETH). We are currently witnessing a wave of DATs whose thesis is to accumulate digital assets as material treasury holdings. The DAT model provides investors with exposure to crypto in an equity-style trade, where investors are not buying the underlying crypto but the company’s stock, which holds crypto tokens in its corporate balance sheet.
DATs can also be contextualised as a wrapper for crypto assets that don’t require investors to deal with self-custody (which can be complex for the majority of users) or exchanges (which may lead to data leaks and social-engineering attacks).
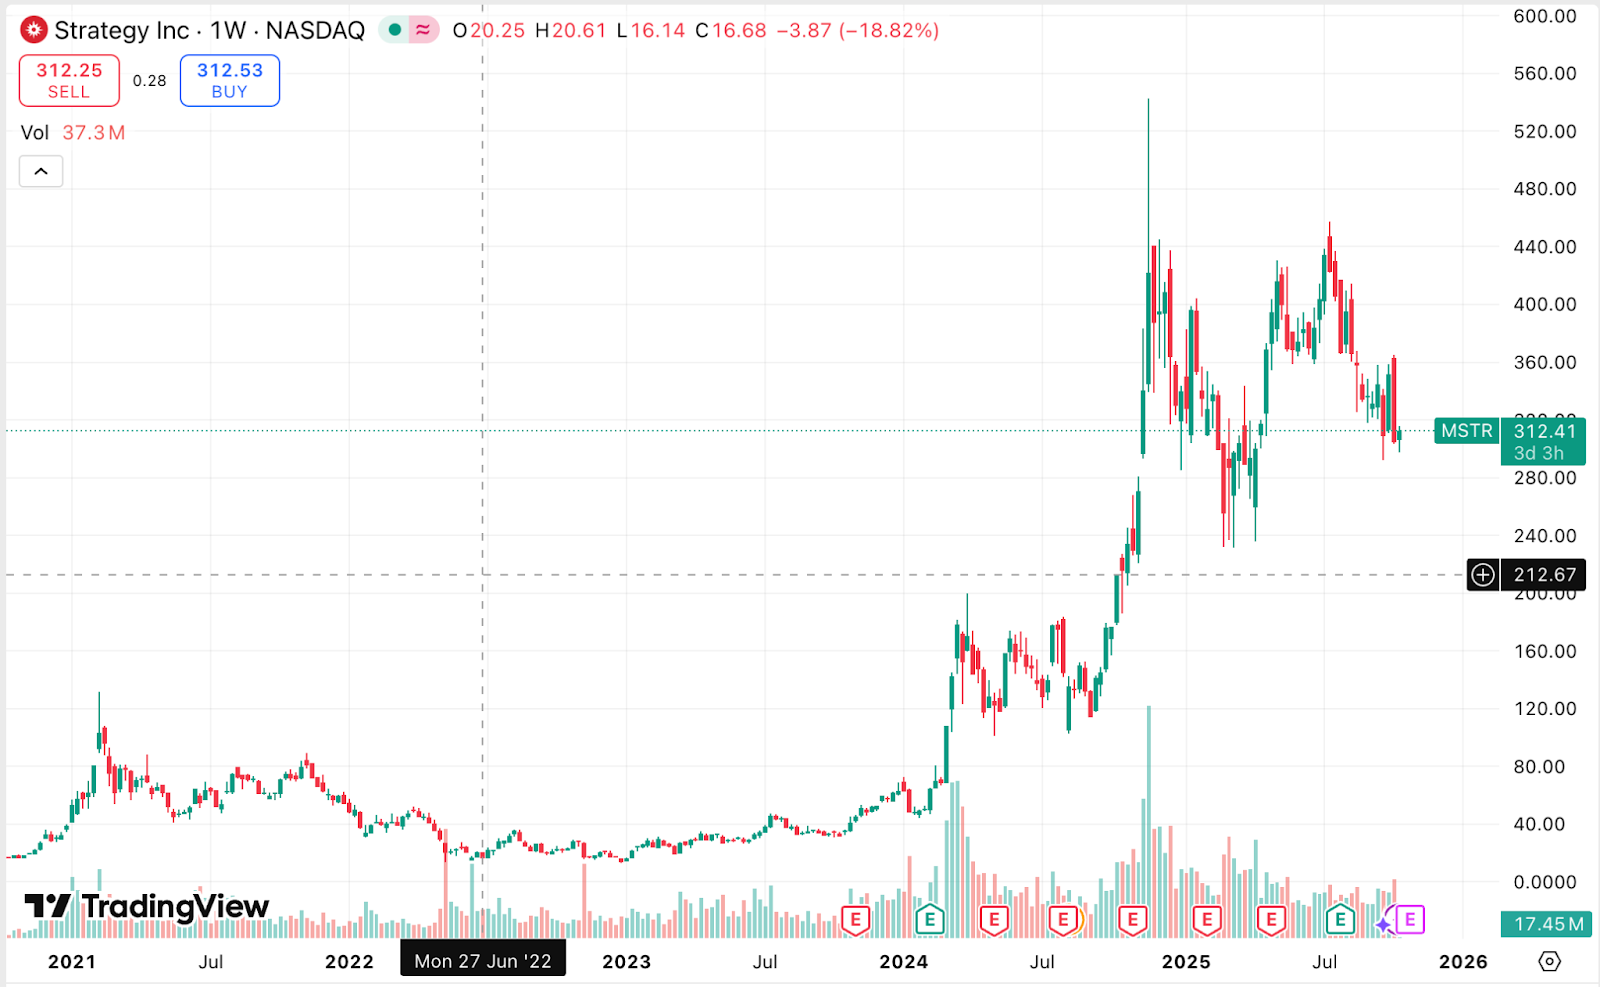
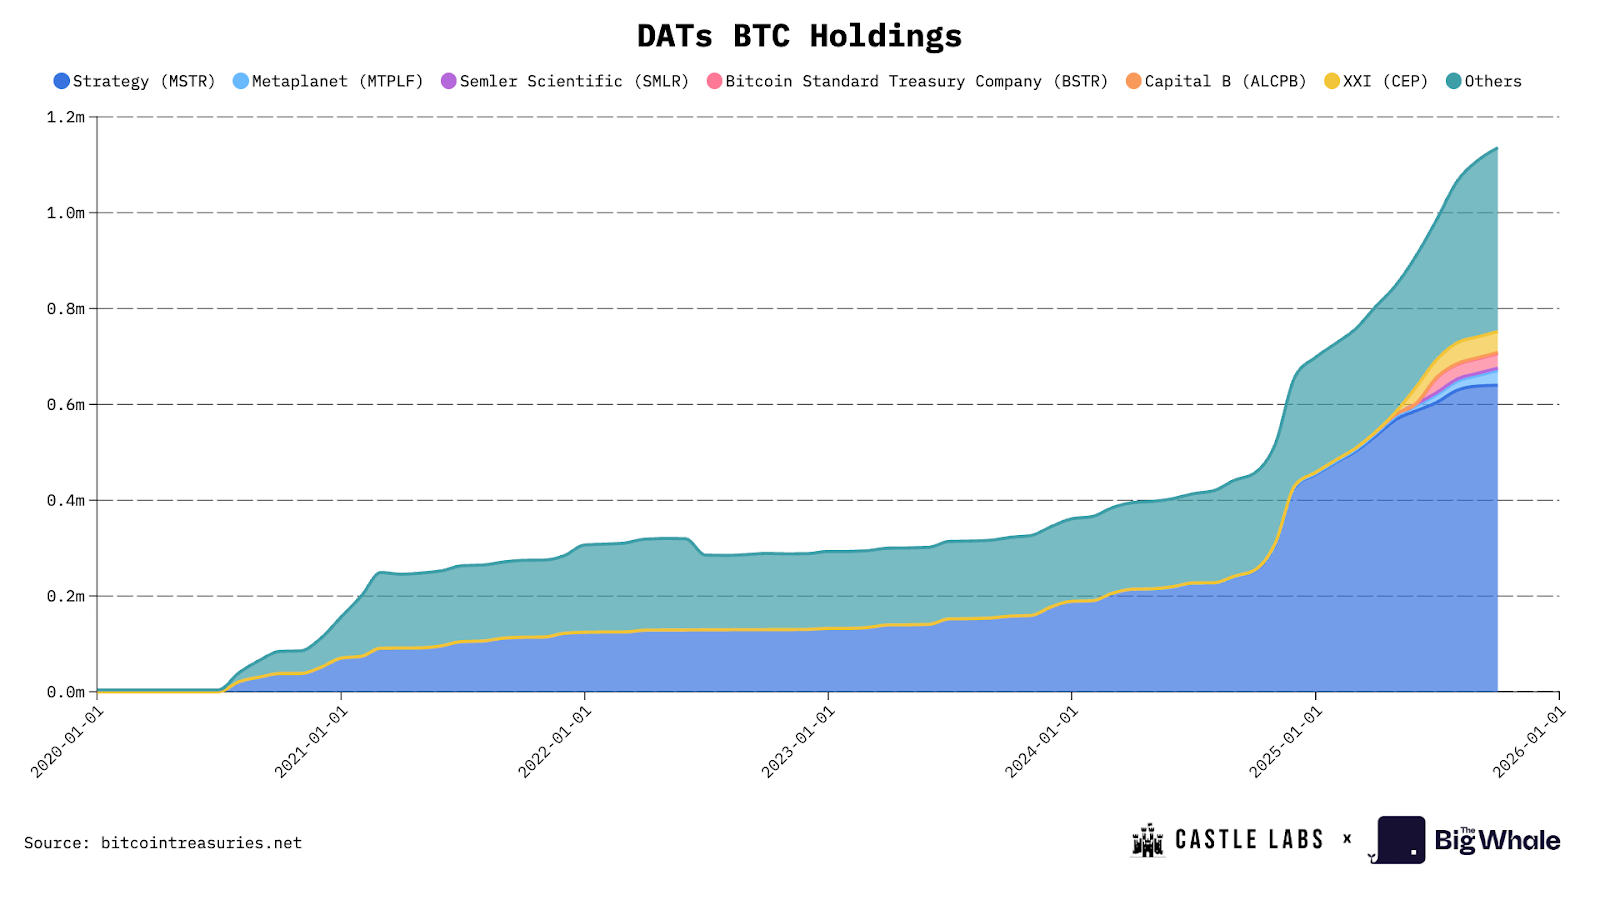
The incumbent DAT, Strategy (formerly known as “MicroStrategy”), currently holds ~640k BTC (3% of the total bitcoin supply).
As Strategy succeeded and its stock ($MSTR) value surged, this model became increasingly attractive to firms, as they could raise capital and perform purchases of digital assets.
These purchases lead to changes in per-share token backing, which ultimately drive speculation on the company’s multiple of Net Asset Value (mNAV) and premiums/discounts.
This piece aims to highlight DATs, how they work internally and what various metrics mean and should be paid attention to. After understanding the core mechanics of the DATs, the report sheds light on their current landscape, the companies involved, the risks associated with them, and ultimately comments on their long-term sustainability.
What are DATs, and how do they work?
The term DAT evolved alongside Strategy’s growth, which previously was a software company providing business analytics services before pivoting to become a DAT in August 2020. Since then, it has increased its stock value by over 2000%. While this was partially attributed to Strategy being the only vehicle of this kind to purchase Bitcoin, it shows the feasibility of the DAT model as a lucrative business opportunity. This section of the report examines how these DATs operate, their core mechanics, and their revenue model.
DAT Types
A DAT functions as an “equity-funded accumulation vehicle”, whose goal is to raise capital, perform token purchases, and increase the exposure of its balance sheet to digital assets. Specific key DAT business and valuation metrics, including NAV, mNAV, and premiums/discounts, are dependent on the price action of their treasury holdings.
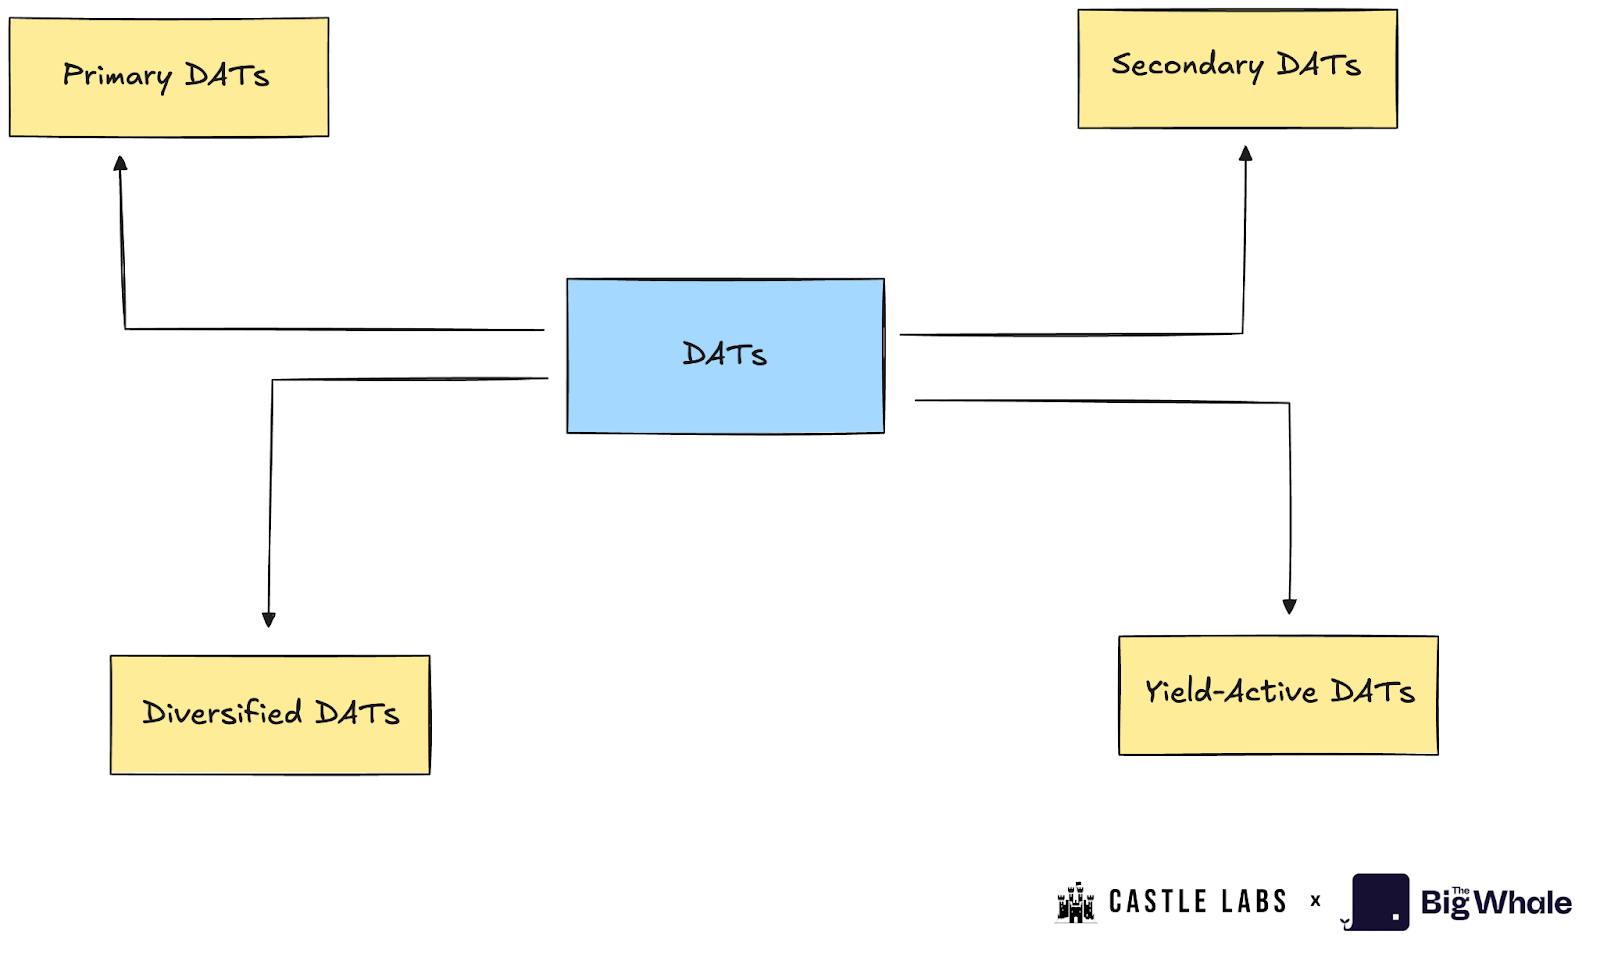
DATs can be classified into different categories as follows:
Primary DATs: They are the canonical “DATs” that utilise equity raises to accumulate a specific asset, such as BTC or ETH. A prime example in this category is Strategy and BitMine.
Secondary DATs: Secondary DATs don’t operate on the DAT model and offer additional business offerings that attest to their stock value, utilising digital assets for diversified exposure. These companies generate operational revenue from other business offerings and use that to accumulate crypto assets. Companies like Tesla, Galaxy, and MARA fall into this category.
Yield-Active DATs: Yield-Active DATs aim to generate yield from their crypto holdings. A prime example in this category is Sharplink, which stakes most of its ETH holdings and earns a staking return on them.
Diversified DATs: Diversified DATs still accumulate crypto, but they are not focused on a single asset; instead, they have exposure to multiple assets. Companies that may fall into this category are Nepute Digital Assets Corp (BTC, ETH, SOL) and BTCS Inc (ETH, ADA, SOL)
While this report doesn’t actively distinguish between these different DATs, it focuses on a few selected ones as case studies.
Key Terminologies behind DATs
To better understand the mechanics of DATs, this section will provide an introduction to key terms that indicate a DAT’s health.
Net Asset Value (NAV): This is the net value of the DAT’s treasury, which is calculated by multiplying the asset count in the treasury by its value in dollars. So, for example, if a DAT holds 10k BTC (1 BTC = $114k), the NAV will be $1.14 billion.
NAV per Share (NAVps): The NAV divided by the number of fully diluted shares outstanding. It is the value that reflects how much one share should be worth based on the company’s treasury holdings. If the market price is greater than the NAVs, the company is trading at a premium; otherwise, it is trading at a discount.
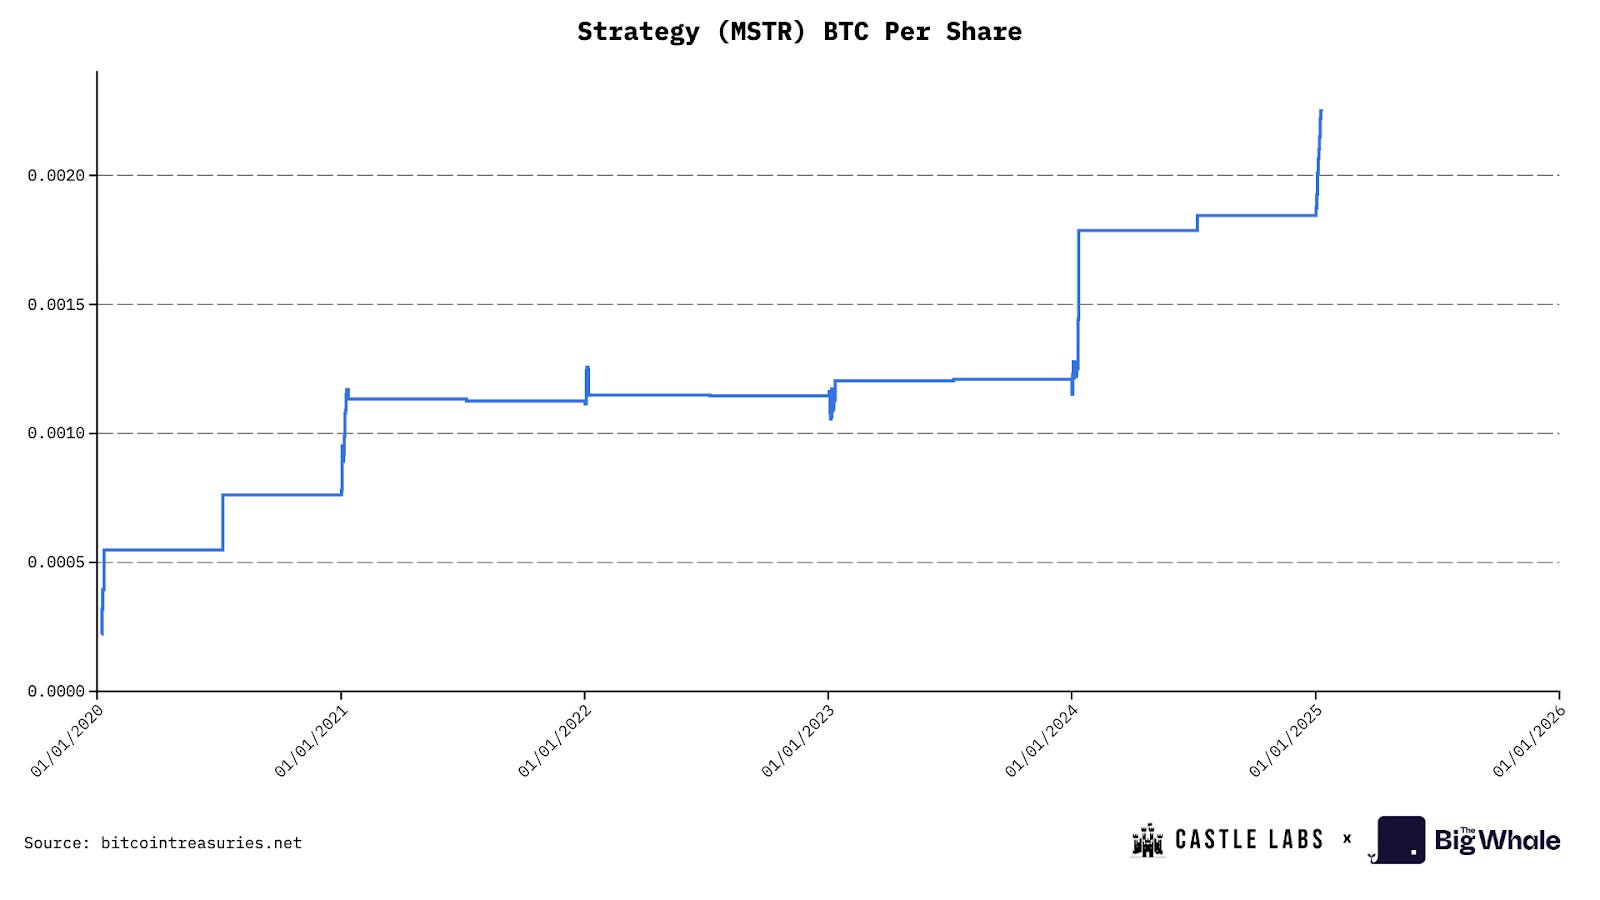
Crypto Per Share (CPS): The number of crypto units each share represents. It measures the amount of BTC, ETH, or other assets each share entitles you to.
Market NAV (mNAV) Ratio: The ratio between the company’s equity market cap and its NAV. If the mNAV is greater than 1.0, then the stock trades at a premium to treasury (investors paying extra for access, leverage, or optionality). On the other hand, if mNAV is below 1.0, the stock trades at a discount (due to market scepticism, governance risk, or poor disclosure).
Accretion/Dilution Test: Stock issuance is only accretive to CPS if the crypto purchased per new share exceeds the current CPS. So an accretion occurs when:
(ΔU / ΔS) > (U / S)
where ΔU are the new crypto bought,
ΔS are the new shares issued,
and U and S representing the current crypto units and old shares, respectively.
To put this into perspective, let’s consider a company that raises $1 billion, trades at a 40% premium (mNAV = 1.4), holds 200k BTC (NAV = $22 billion) in its treasury, and has 20 million shares trading in the market with a total market cap of $30.8 billion. This would mean that the price per share will be $1540, hence they would need to sell 650k shares to perform this raise.
With this raise, they buy another 9k BTC (1 BTC = $110k). So, their new treasury holdings become 209k BTC. So, the old CPS was 200k/20M = 0.01, and the new CPS is 209k/20.65M = 0.0101, which means this raise was slightly accretive for investors.
DAT Funding Mechanism
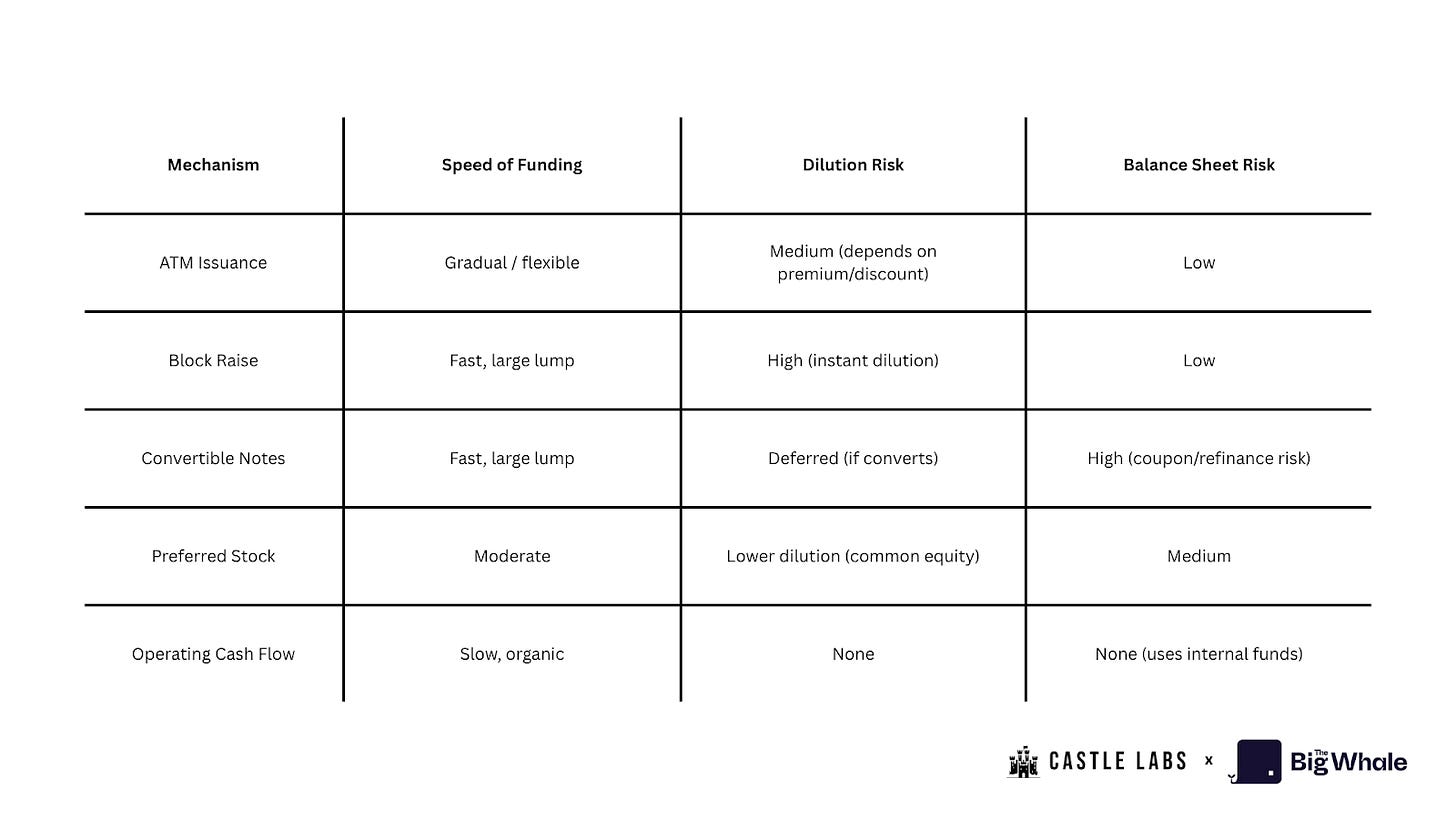
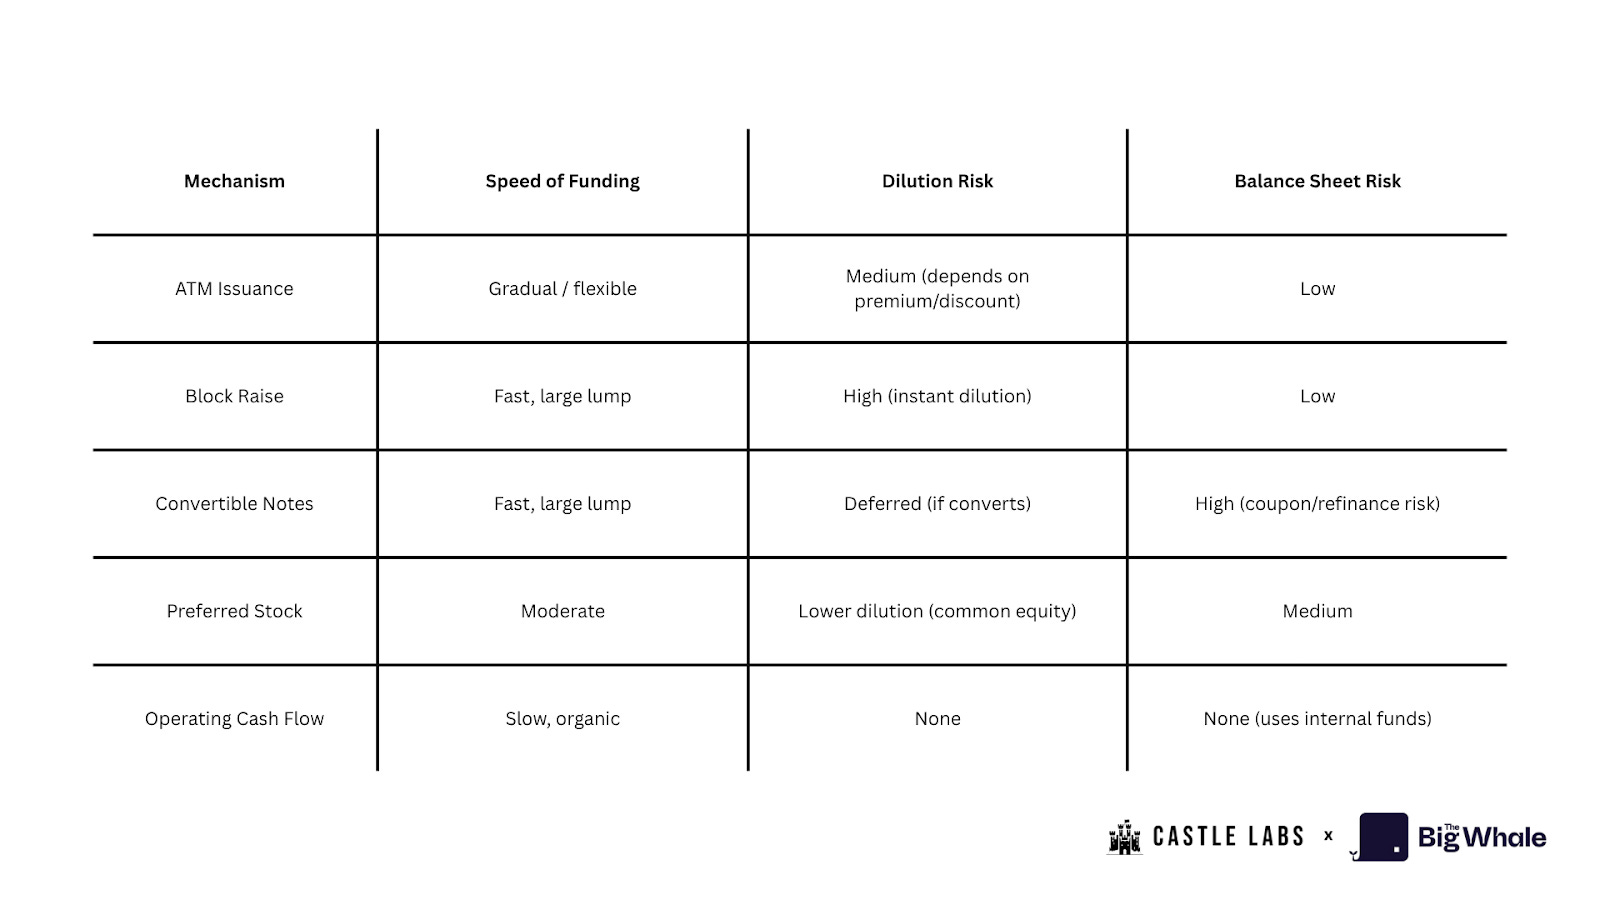
There are different ways a DAT could fund its treasury. Here are a few major ones:
At-the-Market (ATM) Issuance: In this approach, the company establishes an ATM program with an investment bank, selling its shares gradually in the open market and utilising the proceeds to acquire digital assets. This primarily works when the stock is trading at a premium to NAV. This is a flexible, low-friction capital-raising tool that can dilute shareholders if used aggressively.
Block Raises / Secondaries: The Company issues a large block of shares and sells them to investors at a slight discount. The proceeds are utilised to execute large crypto purchases. This mechanism is a quick and substantial treasury addition that can lead to short-term dilution.
Convertible Notes: To raise capital this way, a company issues debt securities (notes) with a fixed coupon (interest rate), a maturity date, and a conversion feature (holders can convert debt into equity at a set price, which is usually above the current market price enabled by the embedded OTM call option). It allows for funding without immediate dilution and can lead to two scenarios: if the stock price rallies and stays above the conversion price for an extended period of time, the company can call for the debt to convert into equity, resulting in a dilution event; and if the price falls, the debt remains debt, leading to repayment/refinancing risk.
Preferred Stock: The company can raise capital by issuing equity instruments that have seniority over common stock in terms of dividend rights and liquidation preferences. These instruments may come with fixed dividends, convertibility, or special rights. This funding mechanism reduces the cost of capital relative to pure equity, but creates a “senior equity” class that reduces upside for common shareholders.
Operating Cash Flow (OCF): Instead of raising new equity or debt, the company allocates a portion of its operating profits to purchase crypto assets. It is the least dilutive and most sustainable way to build a treasury, characterised by a slower accumulation pace.
The DAT Landscape Today
Growing institutional appetite for digital assets led to the creation of a diversified plate, full of equity from different companies trying to capitalise on one of the leading narratives of 2025. From Strategy focusing on BTC as an underlying asset, DATs quickly evolved, focusing on other major L1s such as Ethereum, Solana and more. Every single management unit of DAT companies is fixated on increasing the digital asset unit-per-share metric.
The DATs analysed in this section represent the majority of AUM across all publicly traded companies for the respective underlying asset. Strategy and Metaplanet collectively hold 64% of the total AUM across all publicly traded BTC DATs, with Strategy accounting for 61.22% of all AUM in the BTC DAT market.
Concerning ETH DATs, Bitmine has 49.66% of the total AUM of all ETH DATs, while Sharplink owns 14.72% of the total AUM in the ETH DAT market. We can highlight strong concentration in both the BTC and ETH markets, with early adopters dominating the market share.
Strategy pioneered the DAT concept in 2020, and it took four and a half years for the market to become “mainstream” with contenders emerging in both Bitcoin (Metaplanet) and Ethereum (Bitmine and Sharplink) markets.
Strategy is a pioneer in the space, embarking on its journey of perpetual Bitcoin acquisition. Over the 5 years, the company amassed 640,250 BTC, with a NAV of ~$70 billion (based on today’s prices). In 2025, the company bought 116,554 coins, achieving a BTC yield of 26%.
Chronologically, Strategy has utilised the ATM model to acquire Bitcoin, selling its shares at a premium as high as 6x in the early days, which has since fallen significantly to the 2.5x-3x range, before settling at sub-1.5x mNAV, currently at 1.16x basic NAV, and 1.293x fully diluted mNAV.
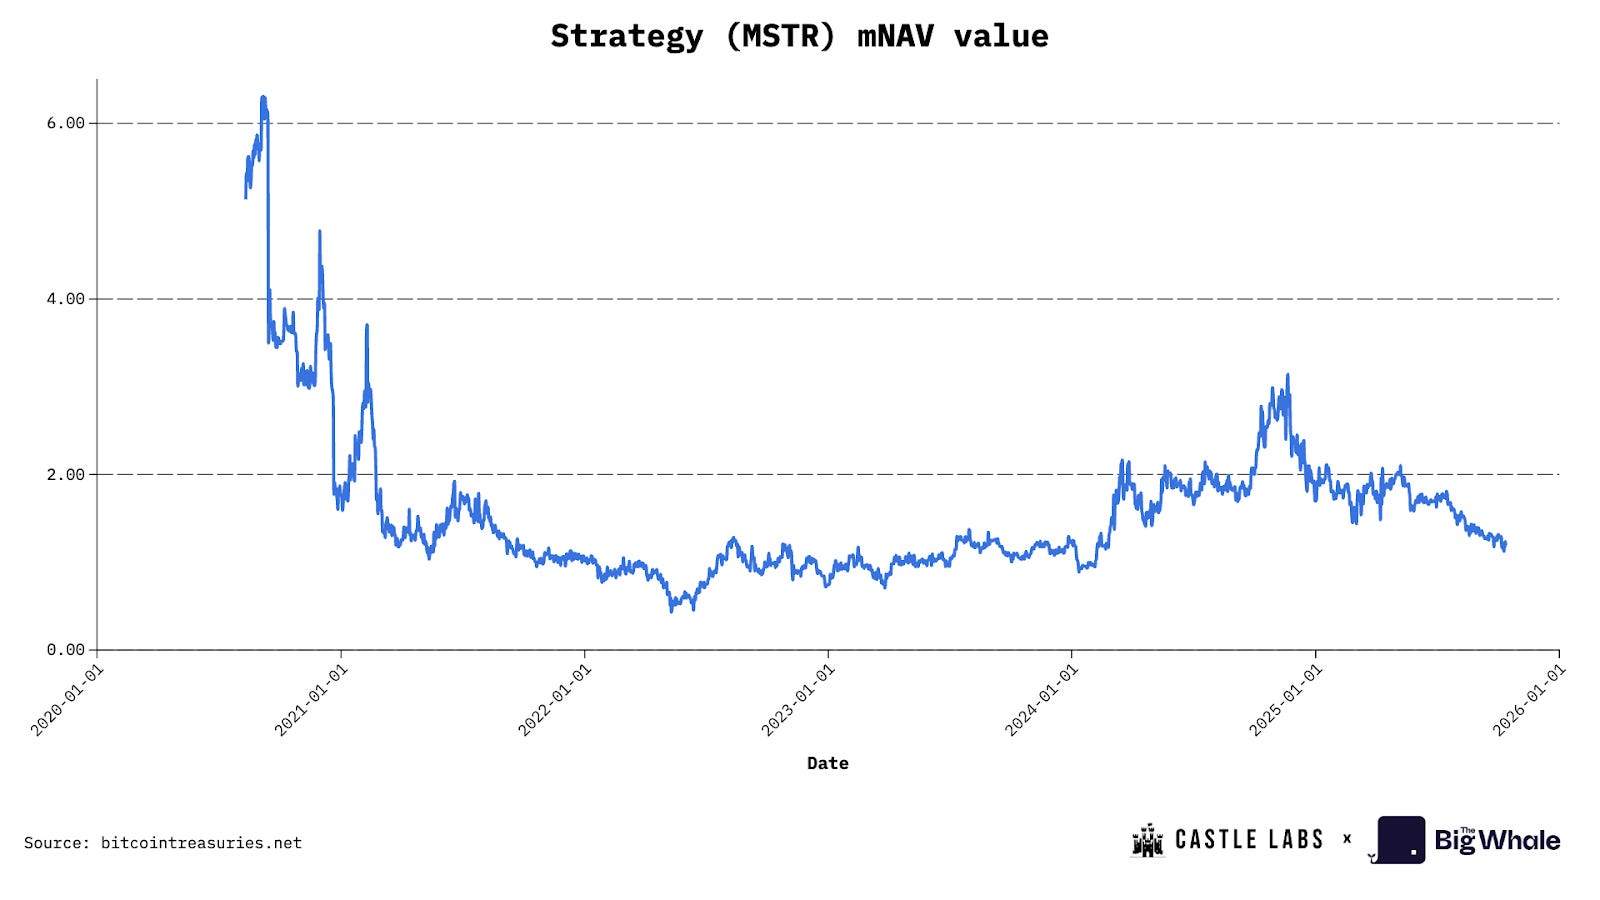
MSTR mNAV premium, Source: BITCOINTREASURIES.NET
Currently, the most dominant financial products and systems for capital raising are preferred shares and convertible bonds, which are gobbled up by hedge funds and other institutional players to offset perpetual share dilution, while still maintaining continual BTC acquisition.
Due to the first-mover advantage and significant recognition from global equity market investors and hedge funds (almost included in the S&P 500), Strategy remains a benchmark, perhaps too big to compare. As such, it carries a lot of responsibility on its shoulders: if it fails, it will create tectonic shifts in both the equity market and confidence in digital assets.
Another significant BTC DAT from Japan is Metaplanet. Originally operated as a hotel business, it now holds over 30,823 BTC. The company utilised its extremely high premium-to-net asset value to acquire BTC. At one point this year, it was almost 8x, allowing them to raise $8 for every dollar of their BTC holdings. The reason for such a premium is the company’s listing on the Tokyo Stock Exchange. Compared to Nikkei, it offers greater volatility than traditional Japanese stocks, which adds BTC exposure for an average Japanese stock market investor.
Now onto the ETH DATs. Originally started as a mining firm focused on immersion-cooled data centres for Bitcoin operations, BitMine made a pivot in July 2025 to become a leading ETH treasury company. It is followed by Sharplink, a marketing tech firm for sports betting and the second-largest ETH DAT. Together, these two companies hold more than 3.87 million Ether, worth more than $15 billion. Reported Earnings per Share are 189.1% for BitMine and 98.5% for Sharplink, respectively. Similar to Metaplanet, both companies prefer ATM equity raises as a dominant strategy to acquire ETH, selling shares at a premium, while the premium exists. By doing so, they can raise capital in an effective way, without needing dilutive block offerings or debt financing, resulting in digital asset unit per share accretion. If the premium disappears, mNAV drops below 1; such a move would lead to dilution, decreasing digital asset units per share in the process. Sharplink is trading at a mNAV of 0.92x, a minuscule discount, while Bitmine is trading at an 18% premium, or mNAV of 1.18.
One significant advantage of ETH Treasury companies is the ability to stake ETH for native yield. This is a self-automated mechanism to increase ETH per share. Additionally, rewards can be utilised to maximise APY by using them in DeFi protocols or to buy back shares, as Sharplink is doing, thereby offsetting the dilution effect caused by the ATM strategy.
Many of these companies are still in their early stages, apart from MSTR. An aggressive capital raise to seize the opportunity represents quick thinking to capitalise on this bull market by bridging the equity and digital asset markets.
Risks in the DAT Model
The most essential characteristic that attracts capital to these stocks in the first place is the multiple to net asset value (mNAV). Speculators flock to these stocks to multiply returns on the underlying digital assets by buying shares before a significant price run-up, aiming to capture returns of 1.5x to 7x on each dollar invested. However, there is a catch: investors are not buying Bitcoin or Ethereum through these companies. Instead, they are buying volatility wrappers whose entire value is generated by the mNAV at which each DAT is trading. That said, there are numerous risks associated with these types of investments, and market participants must be aware of them.

Major risks can be identified in the business models used to acquire BTC and ETH for the treasury. The first and most obvious burden to the share price is constant share dilution. From 2022 to the end of 2024, Strategy has diluted its shareholders by an average of 45.88% per year. Metaplanet’s share dilution rate is projected to be 98% by the end of the year. In contrast, BitMine and Sharplink’s share dilution rates are exceptionally high due to the ATM ETH acquisition method, respectively 24.25% for BitMine and 11.4% for Sharplink. Dilution rate for Sharplink is calculated QoQ (from Q1 to Q2), while the dilution rate for BitMine is based on the full dilution of its $25 billion ATM program for ETH purchases at today’s share price.
Since operational cash flows are negative (MSTR’s Q2 operational cash flow: -$34 million; Sharplink’s Q2 operational cash flow: -$1.62 million), DATs most often opt for the ATM option to acquire underlying assets. However, this path is only effective in scenarios where a market premium exists. In cases of discounts, companies are unable to maintain the acquisition pace, leading to stagnation in the DA (Digital Asset) per share statistic, and ultimately resulting in additional downside pressure from investors.
To avoid constant dilution, MSTR and other companies raise capital through debt in the form of convertible bonds. Convertible bonds are typically purchased by hedge funds, which often employ a delta-neutral strategy. This appeals to them because convertible bonds have an OTM (out-of-the-money) call option embedded in the bond. As part of their delta-neutral strategy, hedge funds open short positions, exerting constant sell pressure. At the same time, a rise in prices increases the bond’s value due to the appreciation of the OTM embedded call option. Bonds also have a slight coupon that pays an annual rate, further enhancing returns. If the share price approaches the conversion price, the bond’s delta increases, thereby increasing its value. On the other hand, when shares are falling, not only do hedge funds make money on their short position, but the delta declines more slowly due to the over-collateralization from BTC holdings and common shares, which provides a floor to the bond’s value. This is referred to as an option, and in this case, bond convexity.
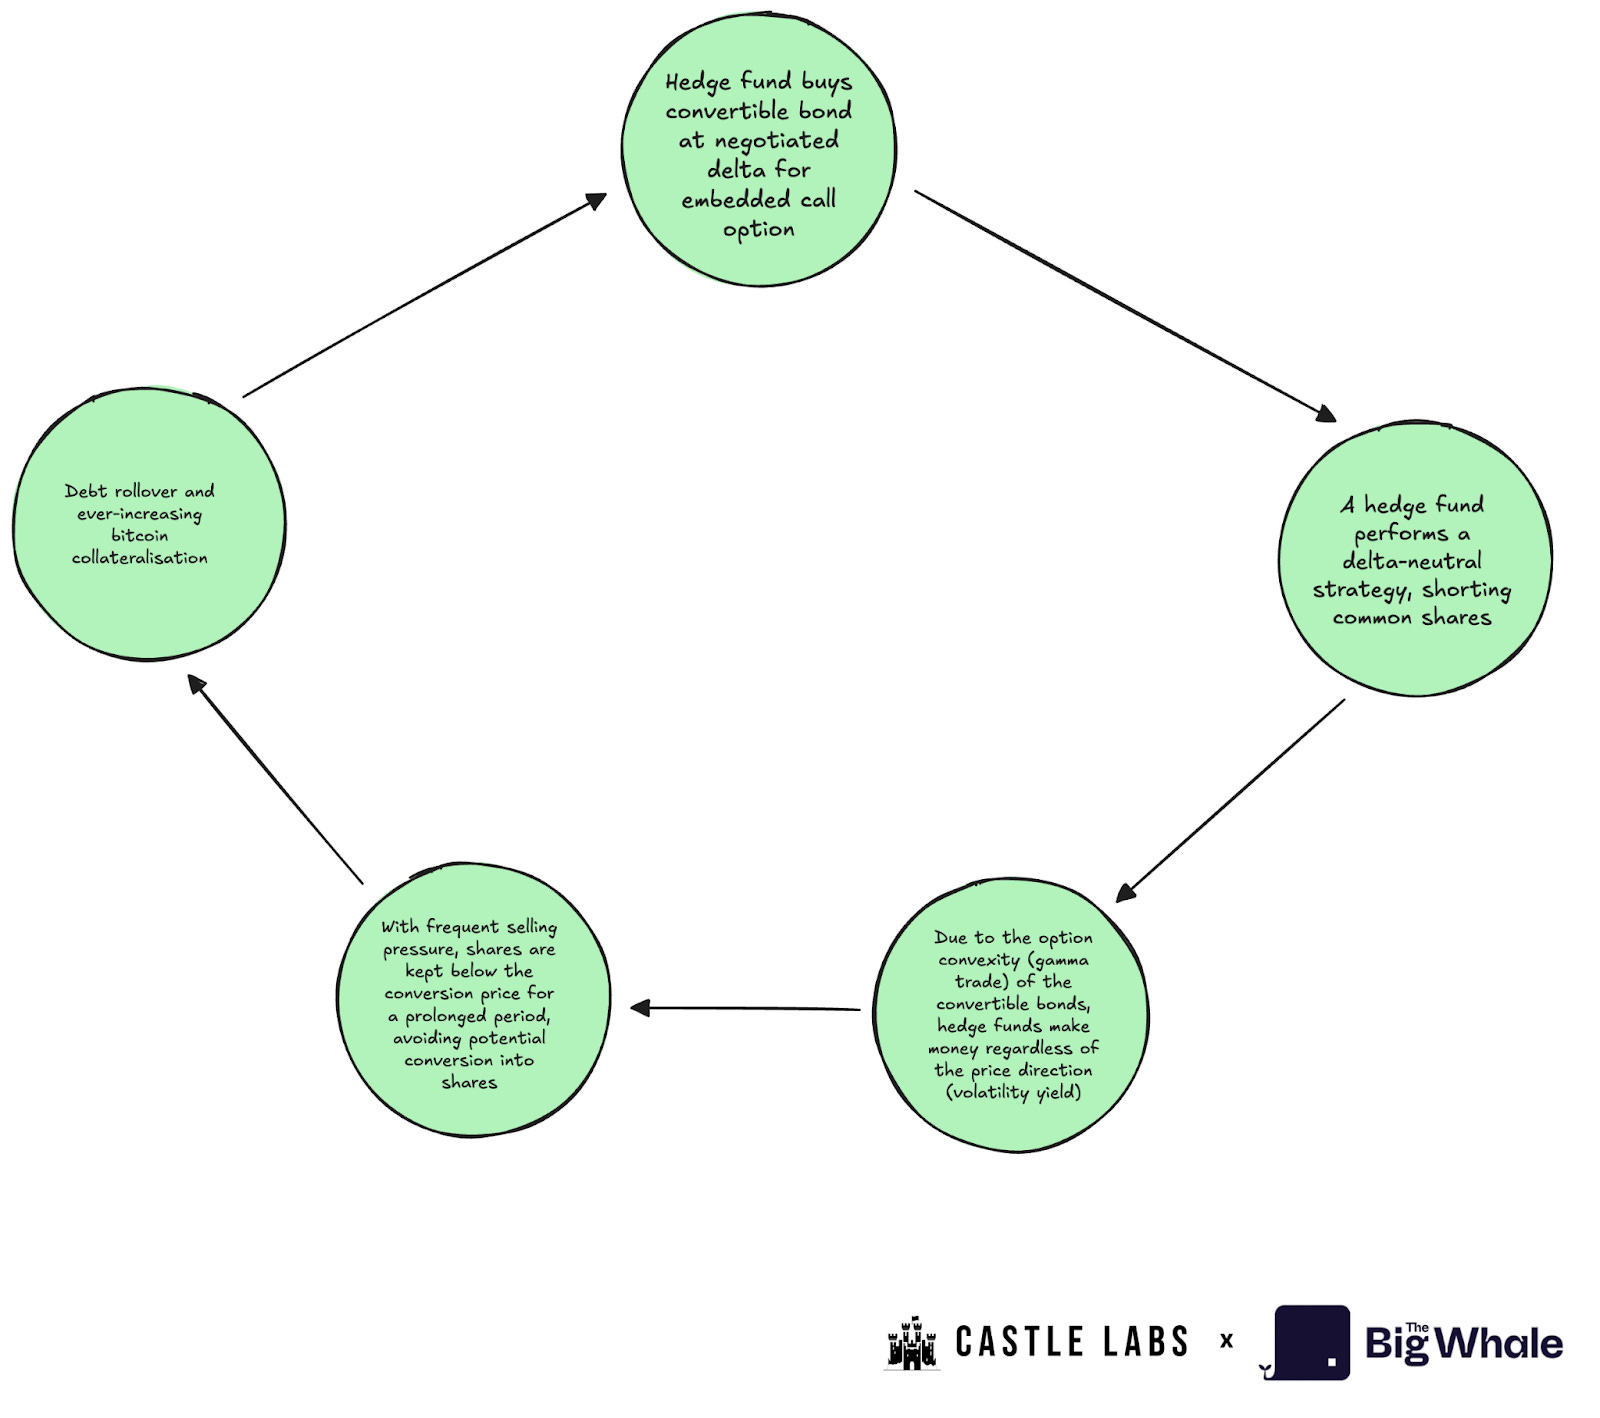
Ultimately, convertible bondholders are incentivised to avoid conversion: While holding the bond, they claim a right to the largest allocation of BTC in the event of bankruptcy and can harness volatility yield for as long as possible. The most optimal scenario for hedge funds is debt rollover. As long as the realised volatility of common stock is high enough to support massive price swings (buy-side speculators are needed for this to happen), hedge funds will be incentivised to hold convertible bonds.
Thirdly, DATs could raise capital by issuing preferred shares. This approach, invented by Strategy, aims to offset dilution without significantly increasing debt levels. One thing that preferred stock offers to its holders is an annual dividend. Given that DATs usually have either negative or minuscule cash flow, this further undermines the profitability of these companies.
Aside from these, we highlight further risks surrounding treasury transparency, executional risk linked to share buybacks (due to a lack of revenue/liquid funds to carry out these operations), liquidity risk in the event of emergency selling, and constant sell-offs by company insiders, which altogether put intense pressure on the share price.
Recently, we have seen massive reductions in market capitalisation of these vehicles, MSTR down 44%, Metaplanet down more than 70%, fueled by all risks being priced in and showcasing the fact that DATs may be running out of steam, and all of that contributes to the reason why DATs underperformed underlying assets at this stage in the bull run.
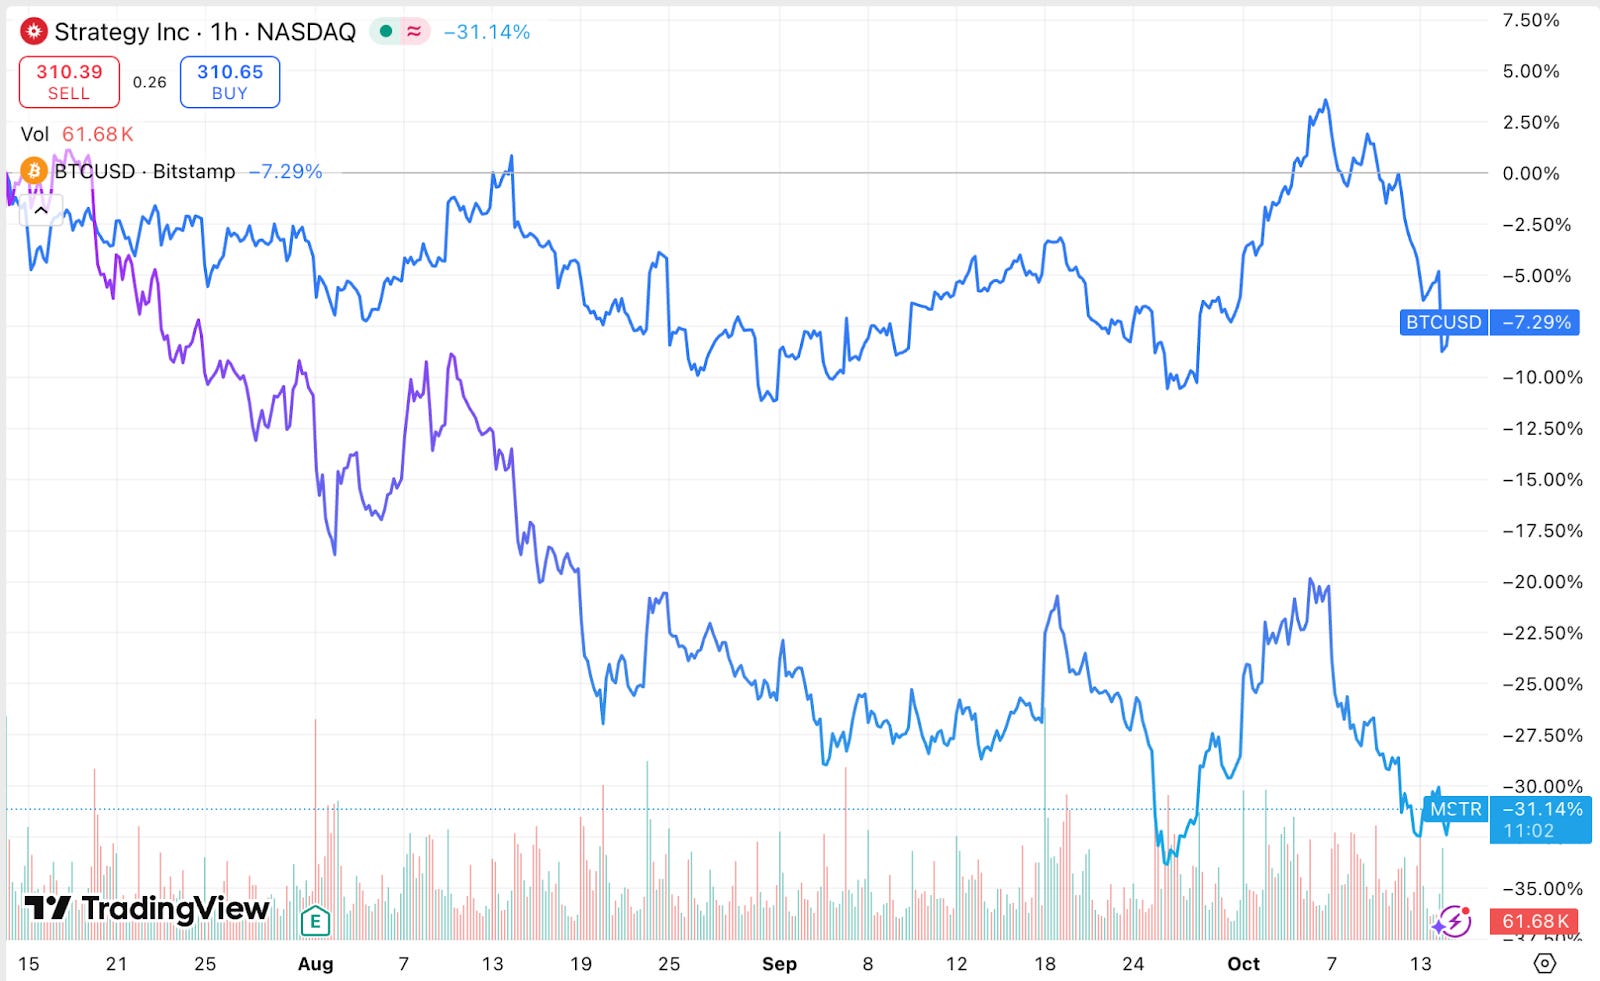
Strategy vs BTC in the last three months
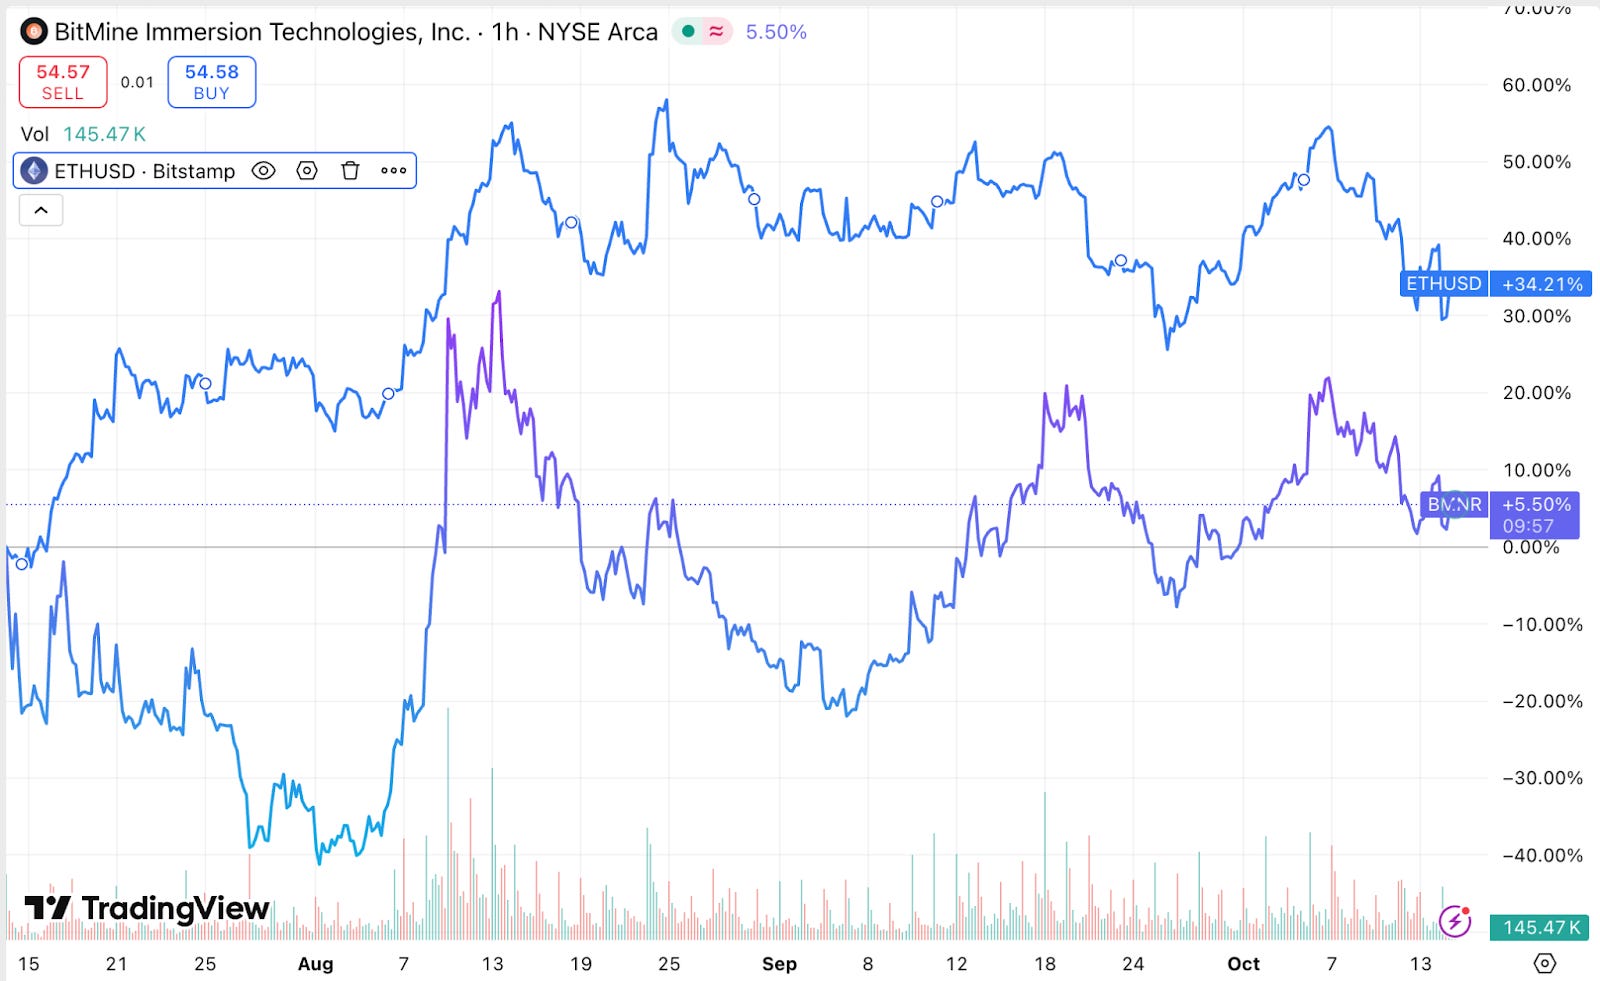
BitMine vs ETH in the last three months
Do DATs Make Sense Beyond Buying BTC or ETH?
Holding Ethereum as treasury assets allows these companies to leverage ETH to accrue a yield of about 3.18%, which benefits the ETH per share metric of DATs. However, even utilising the ETH with the most established DeFi protocols, it would take a long time for DATs to increase ETH per share without additional capital injections, while adding counterparty risk. Although staking and yield farming generate cash flow for ETH and other altcoin DATs, these numbers remain minimal and would be of little help at the current scale. To truly create a self-sustainable ETH flywheel, companies must accumulate the necessary funds to generate a high enough yield to cover all expenses and increase shareholder wealth.
Regarding whether yield-focused DATs, like ETH DATs, can outperform BTC DATs, it depends heavily on the market’s appetite for the underlying assets these companies are built on. Currently, the appetite for BTC DATs is stronger, as indicated by stickier mNAVs, particularly for MSTR compared to BMNR and SBET.
The market has already started pricing in the risks associated with these vehicles, resulting in a significant delta in performance between Q3 DATs and BTC or ETH, with the underlying assets outperforming their equity wrappers.
The acquisition of underlying assets as the core business model makes it very challenging to find intrinsic value beyond the net asset value of DAT’s holdings coupled with bleeding operational cash flows, dividend cash burden, and rising indebtedness levels is the reason for the prolonged decline of multipliers for the most of DATs currently.
Investors are often faced with decisions on where to allocate capital before making a decision. Before each investment decision lies an alternative cost. The breakdown below shows, in a nutshell, what the alternative cost looks like in this example.
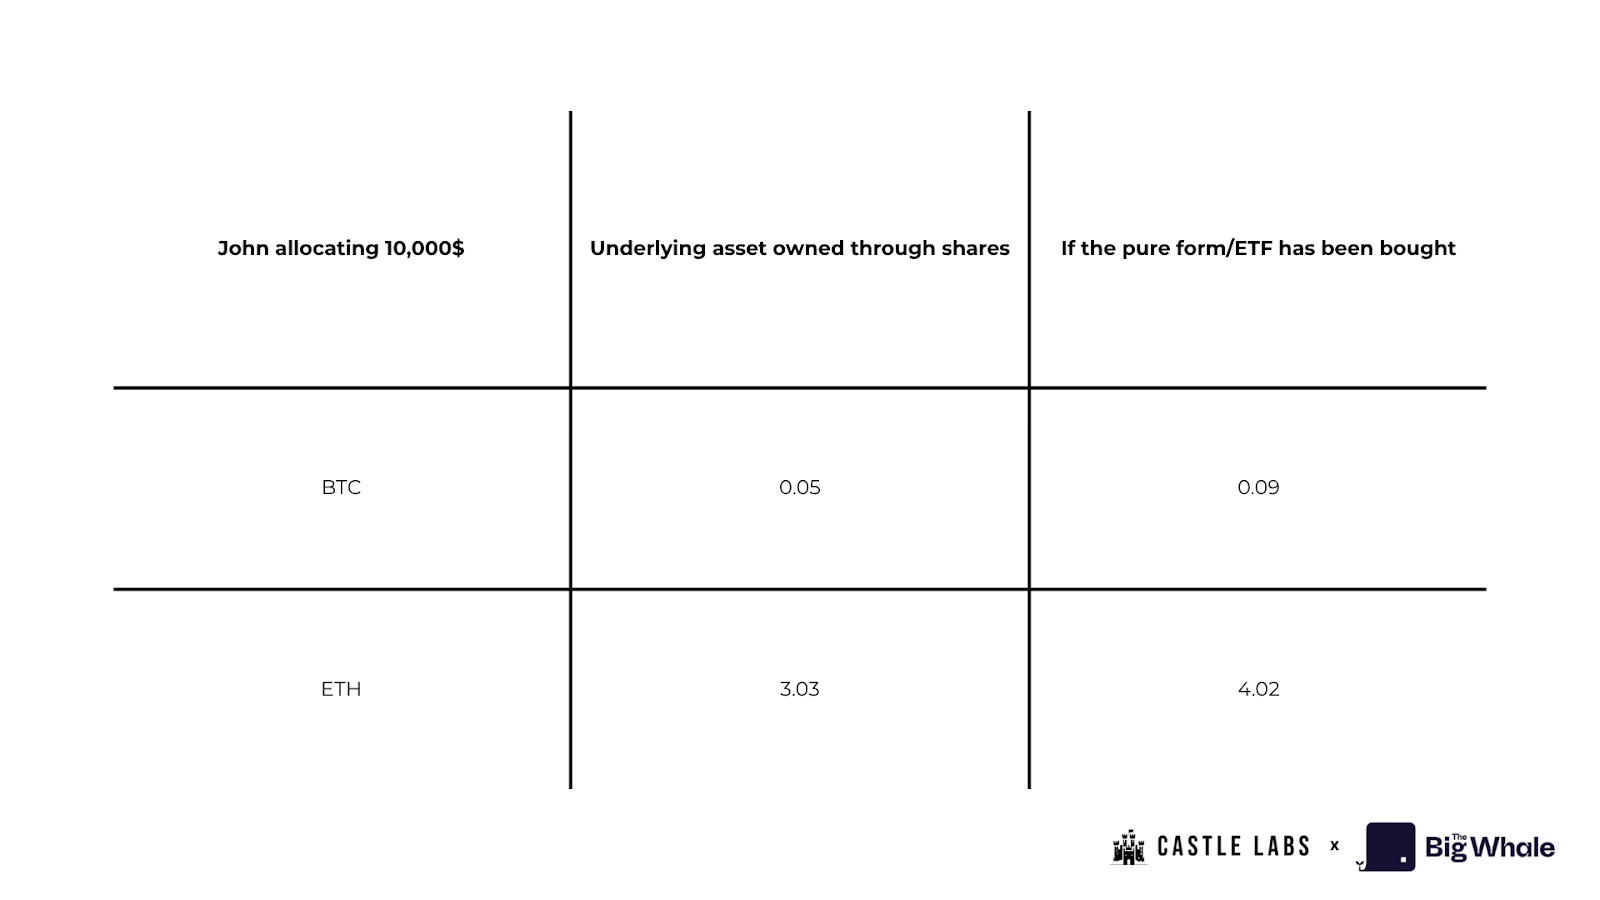
John plans to invest 10,000$ in either pure form/spot ETFs of BTC and ETH (at the end of Q2) or buy shares of either MSTR or SBET (at the end of Q2).
If John decided to put the entire $10k into pure form, he would receive:
0.093 BTC at the Q2 closing price
A bit more than 4 ETH at the end of Q2’s price.
If John had proceeded and bought MSTR and SBET shares instead, he would have received:
24.61 shares of MSTR
1,064.96 shares of SBET at the June 30th prices.
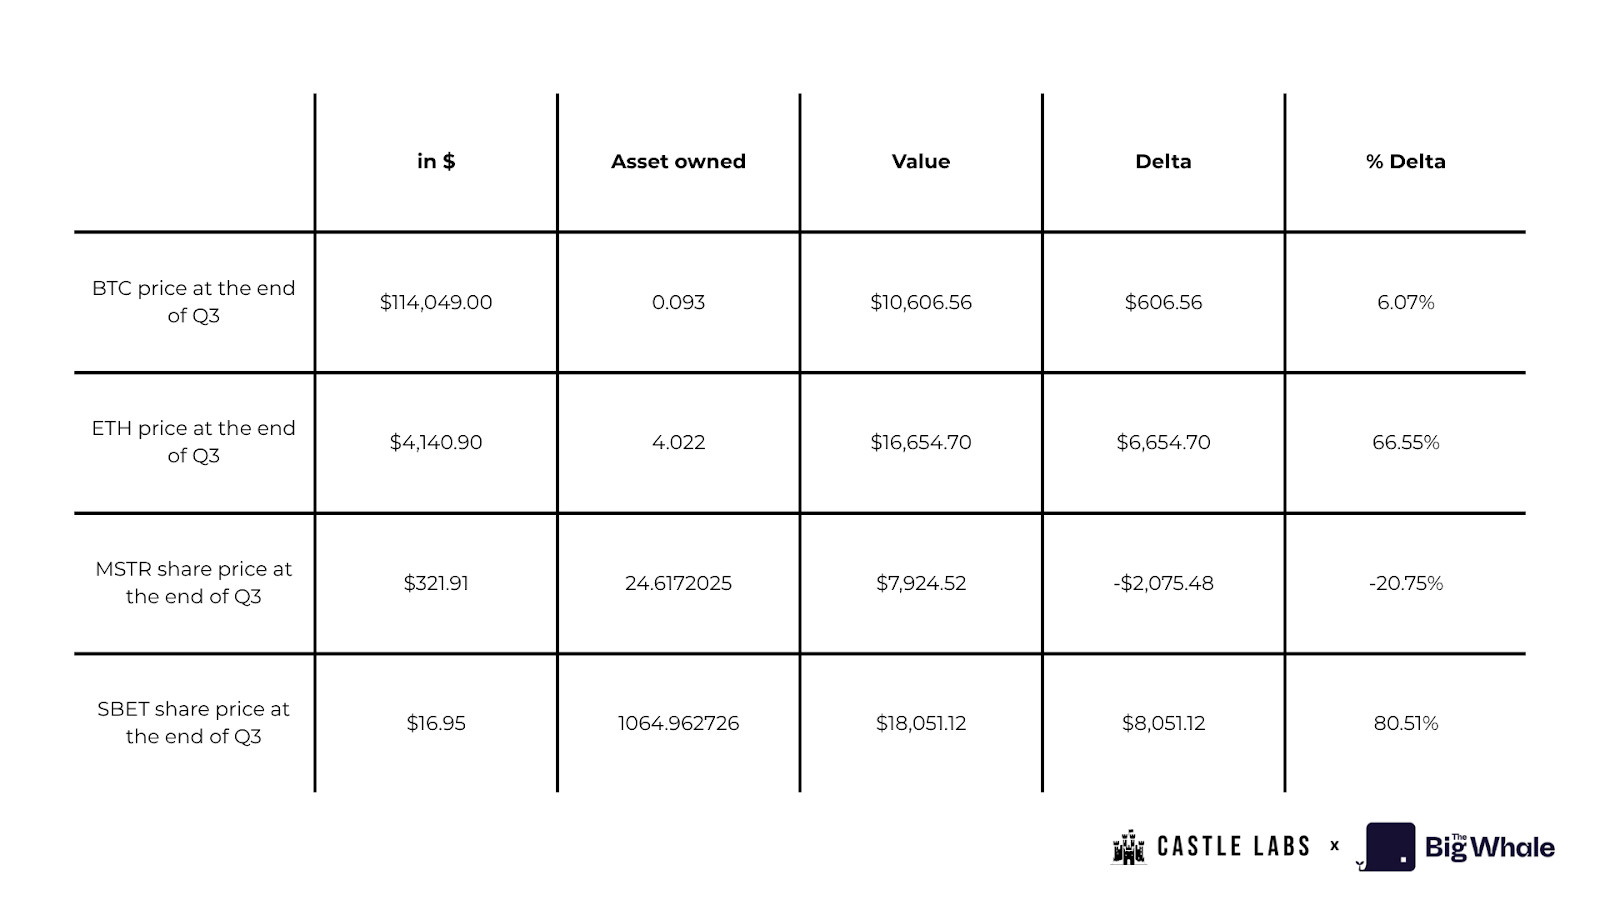
Multiplying the amount of shares with BTC per share today, John would end up holding 0.04 BTC less than if he bought the pure form, as indicated in the delta in the table above, and worst of all, he would end up with only MSTR shares and no Bitcoin. Applying the same scenario on SBET shares, John would end up holding an entire ETH less than if he bought pure form.
However, it’s worth noting that if John hadn’t sold any of his shares by the end of Q3 in $ terms, he would make a significant profit of about $8k on Sharplink’s stock due to the price appreciation of 80% beating both pure form/ETF returns. On the other hand, he would lose a decent percentage on MSTR shares, about -20.75% of his original portfolio value of $10,000.
Not only is the opportunity cost high for DATs, but retail investors end up not owning any of the underlying assets. In the event of bankruptcy, the right to claim the underlying assets belongs to debt holders and preferred shareholders. This raises significant doubts about the sustainability of DAT’s image as a long-term investment, at the very least. However, one differentiating factor that still attracts capital to these volatility wrappers is the ability to earn an amplified return, as opposed to holding a pure form or an ETF, as was seen with Sharplink stock between Q2 and Q3.
Although income statements and earnings might appear strong under FASB accounting rules that allow companies to mark unrealised gains as earnings, earnings are still marked to market and are not converted into free cash flow unless assets are sold. In other words, they reflect changes in the underlying asset’s value on paper but don’t translate into free cash flow unless the gains are realised.
This could all be mitigated if companies invested excess cash that could be generated either by lending out their positions or by creating sustainable income from writing option contracts. However, each new protocol integration would add increasing counterparty risk, raising the question of whether it’s worth it at all. The general market perception is that if these players start selling their holdings, it would be a nail in the coffin for shareholders.
Evaluating Sustainability
Although no set of evaluation metrics can be perfect, given the volatility of digital asset prices, this section delves into a few metrics that provide a comprehensive performance overview of DATs.
While explaining the different metrics to track, we will also evaluate the sustainability of Strategy (MSTR) as an example of how you can decide and score the DAT. To better analyse, we provide scores (0-5) in each of the metrics for Strategy, where:
score >= 4 means they are performing well in that metric
score = 3 means they are performing average in that metric
score <= 2 means they are performing below average in that metric
score = 0 means they are performing badly in that metric
Dilution Risk
Dilution risk arises when the new share issuance impacts existing shareholders’ claim on crypto per share (CPS). If issuance leads to a lower CPS than the current CPS, it’s dilutive; otherwise, it is accretive.
To measure dilution, we track the change in CPS over time, comparing the CPS value before and after each raise.
MSTR: Strategy frequently used ATM equity issuance and convertible offerings to fund BTC accumulation. Because MSTR often issues equity when stock is trading at a premium (mNAV > 1), this can be considered accretive dilution. However, being dependent on continuous raises puts MSTR in the low to moderate dilution risk category. Therefore, we assign it a score of 3.
Leverage
To track a DAT’s leverage, we track the debt it uses to buy digital assets. Convertible notes, secured loans, or other similar instruments could secure the debt.
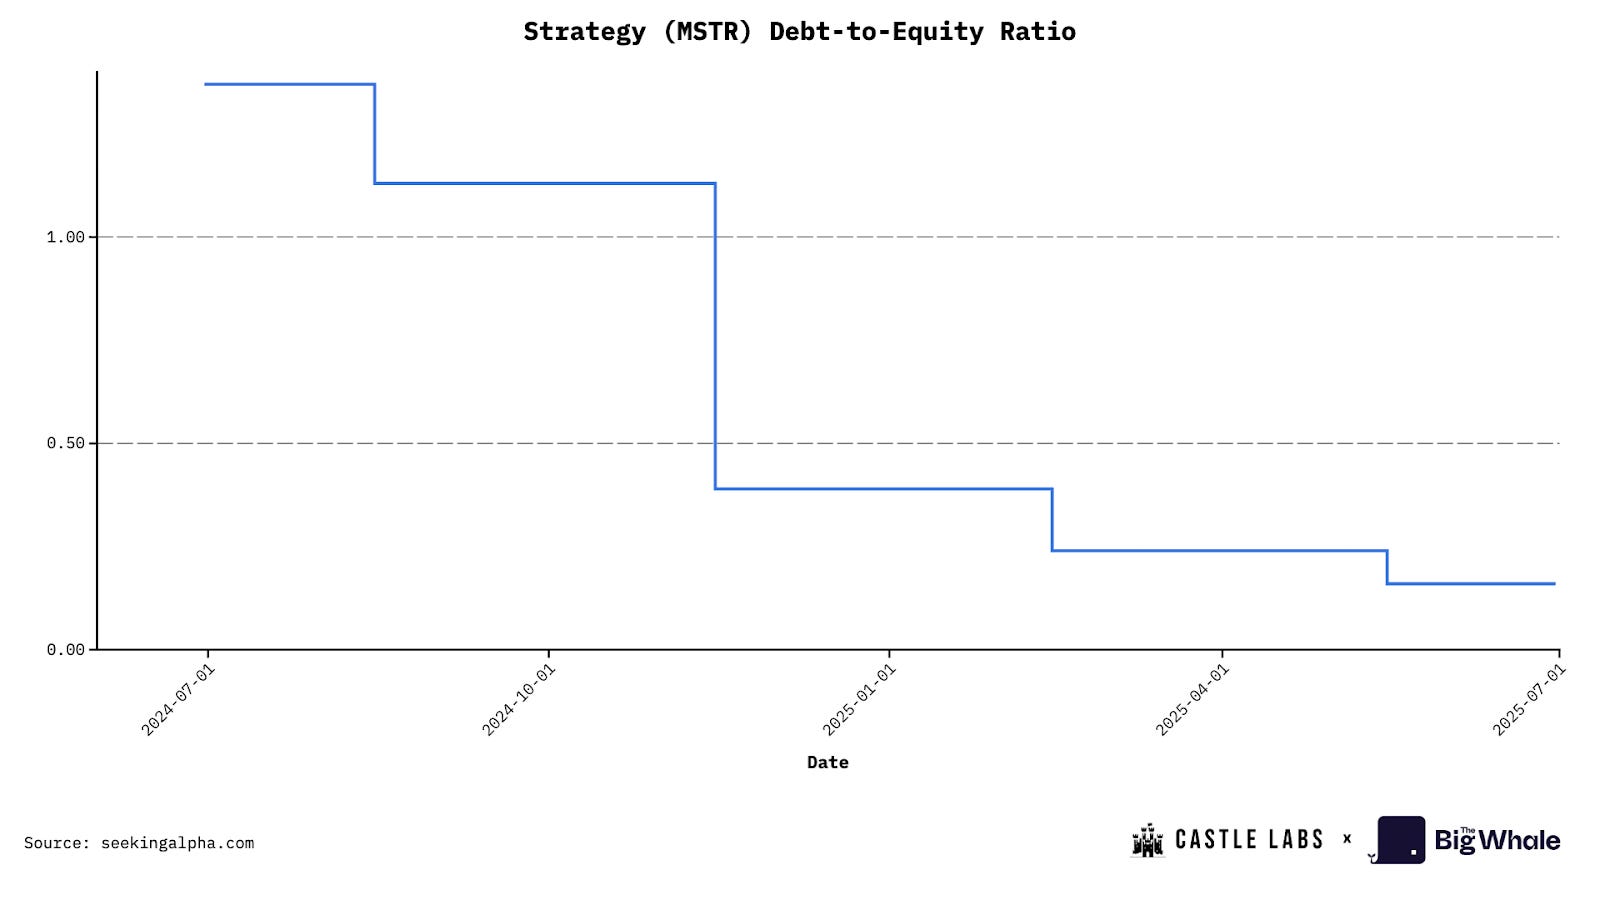
To measure the leverage, we track the debt-to-equity ratio to understand how significant drawdowns in treasury assets can impact the company’s leverage and whether they could lead to a liquidity crunch.
MSTR: Strategy debt-to-equity ratio is at its lowest point at the time of writing and stands at 0.36, which puts it in a category of lower leverage, giving it a score of 4.
Choice of Underlying Asset
The quality of crypto assets that DAT holds in its treasury is what makes it investor-aligned. Most of the DATs are related to blue-chip assets, such as BTC, ETH, and SOL.
ETH sets itself apart with its ability to generate a sustainable yield that can be used either to fund a company’s operations or increase its treasury. CPS value is also a significant factor. For example, staking ETH currently yields a staking APR of ~3%. If a DAT holds $1 billion in ETH, it can earn an additional $30 million per year by simply staking it. They can further decide to participate in more appealing yield opportunities across lending or other liquidity provisioning avenues. However, it is also important to note that the latter comes with counterparty risk. This is also the case for Solana DATs.
This is different for BTC, which doesn’t offer active yield opportunities and mostly derives its attractiveness due to being regarded as digital gold due to its limited supply and money-like properties. An increasing number of companies are already including BTC in their corporate balance sheets, a good indicator of its growing significance as an asset.
MSTR: Strategy holds BTC, which is growing as an asset, but has lower underlying yield opportunities (that may improve in the near future). Given this factor, we place it in the medium category, which earns it a score of 3.Multiplier to NAV Ratio (mNAV)
The Multiplier to NAV Ratio is the easiest and strongest indicator to calculate for analysing the state of a DAT. It is simply the company’s equity market capitalisation divided by its NAV or treasury holdings value.
MSTR: Strategy Market Cap is $82.3 billion, and its NAV is ~$70 billion, resulting in an mNAV of 1.16 basic, and 1.25 fully diluted.
To categorise the DATs based on mNAV, we can give them the following scores based on their basic mNAV value:
if mNAV > 1.2, score = 4 or 5 (good)
1.0 < mNAV < 1.2, score = 3 (average)
0.8 < mNAV < 1.0, score = 1 or 2 (below average)
0.8 > mNAV, score = 0 (bad)
Hence, Strategy gets a score of 3.
Treasury Transparency and Governance
This is a more qualitative measure that tracks the quality and frequency of disclosures a company makes regarding its treasury and proof of reserves, as well as its auditing history. In the context of holdings, whether they provide public addresses to track them also matters.
Some companies avoid providing these addresses for tracking, as it might lead to frontrunning issues: purchases made by DATs can cause the price of an asset to surge and be exploited.
MSTR: Strategy typically receives a lot of criticism because it maintains a preferred level of limited transparency regarding proof of reserves. Moreover, its governance structure is complex due to the variety of offerings, including preferred stocks and convertible notes. This gives it a score of 2 in this metric.
Liquidity and Cash Runway
This is a quantitative measure to analyse a company’s current cash flow and, if things go south, whether it would need to sell its crypto assets to keep operations alive.
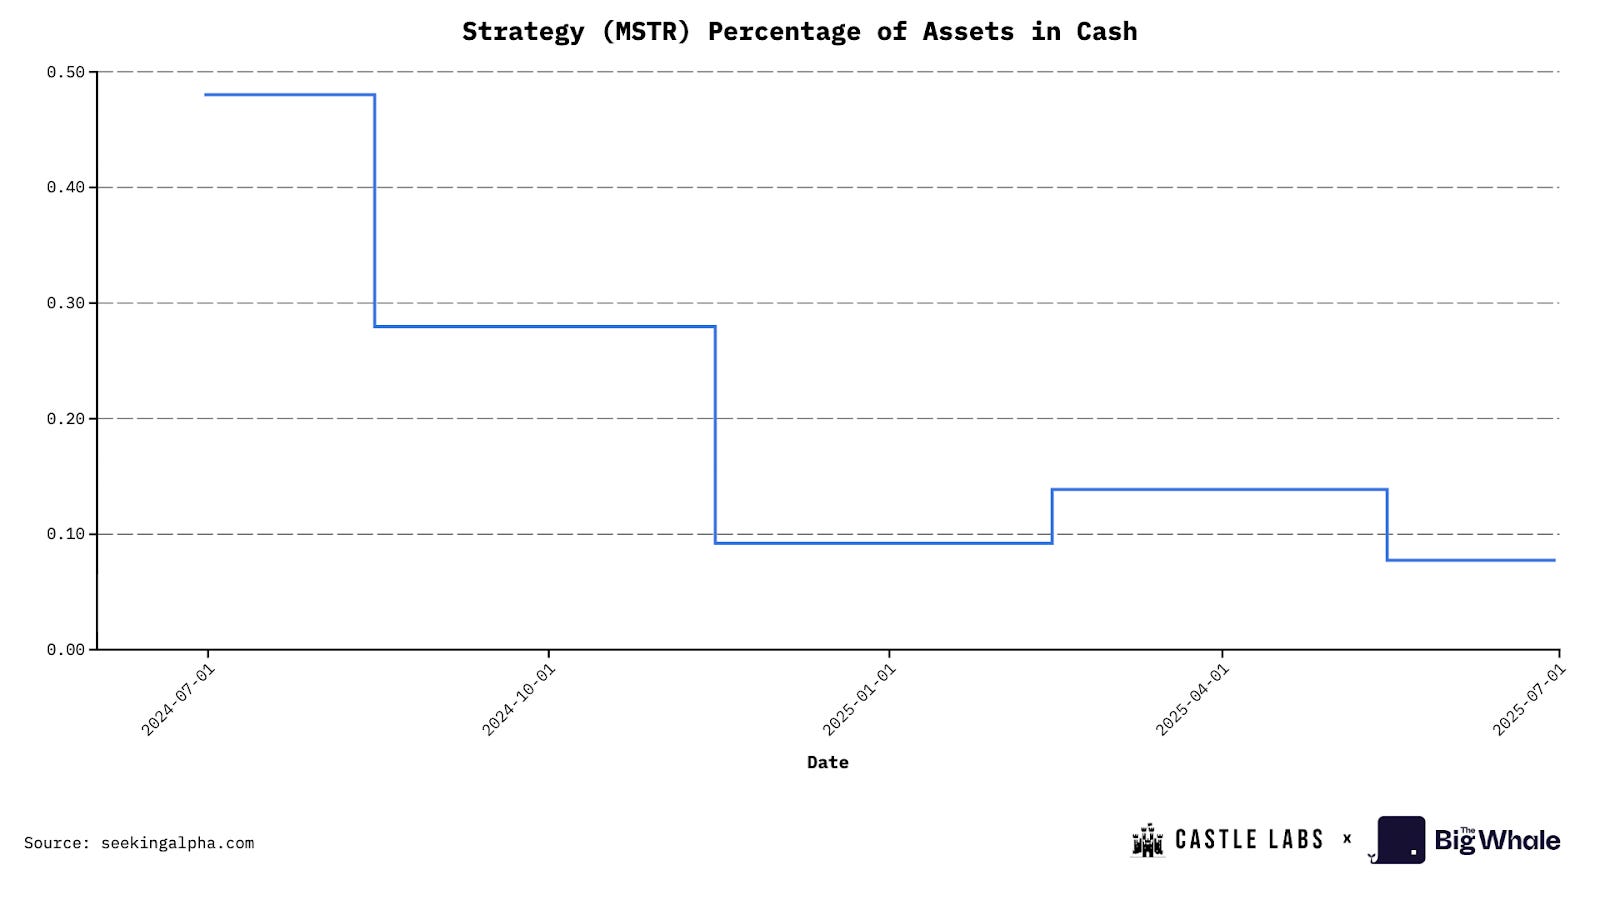
One can analyse the company’s monthly operating expenses and divide them by its cash holdings to better understand its runway. Having at least a year’s worth of runway is a good practice.
MSTR: Strategy has limited cash assets, which currently represent only 0.07% of the total company’s assets. This limited cash ratio gives it a score of 1.
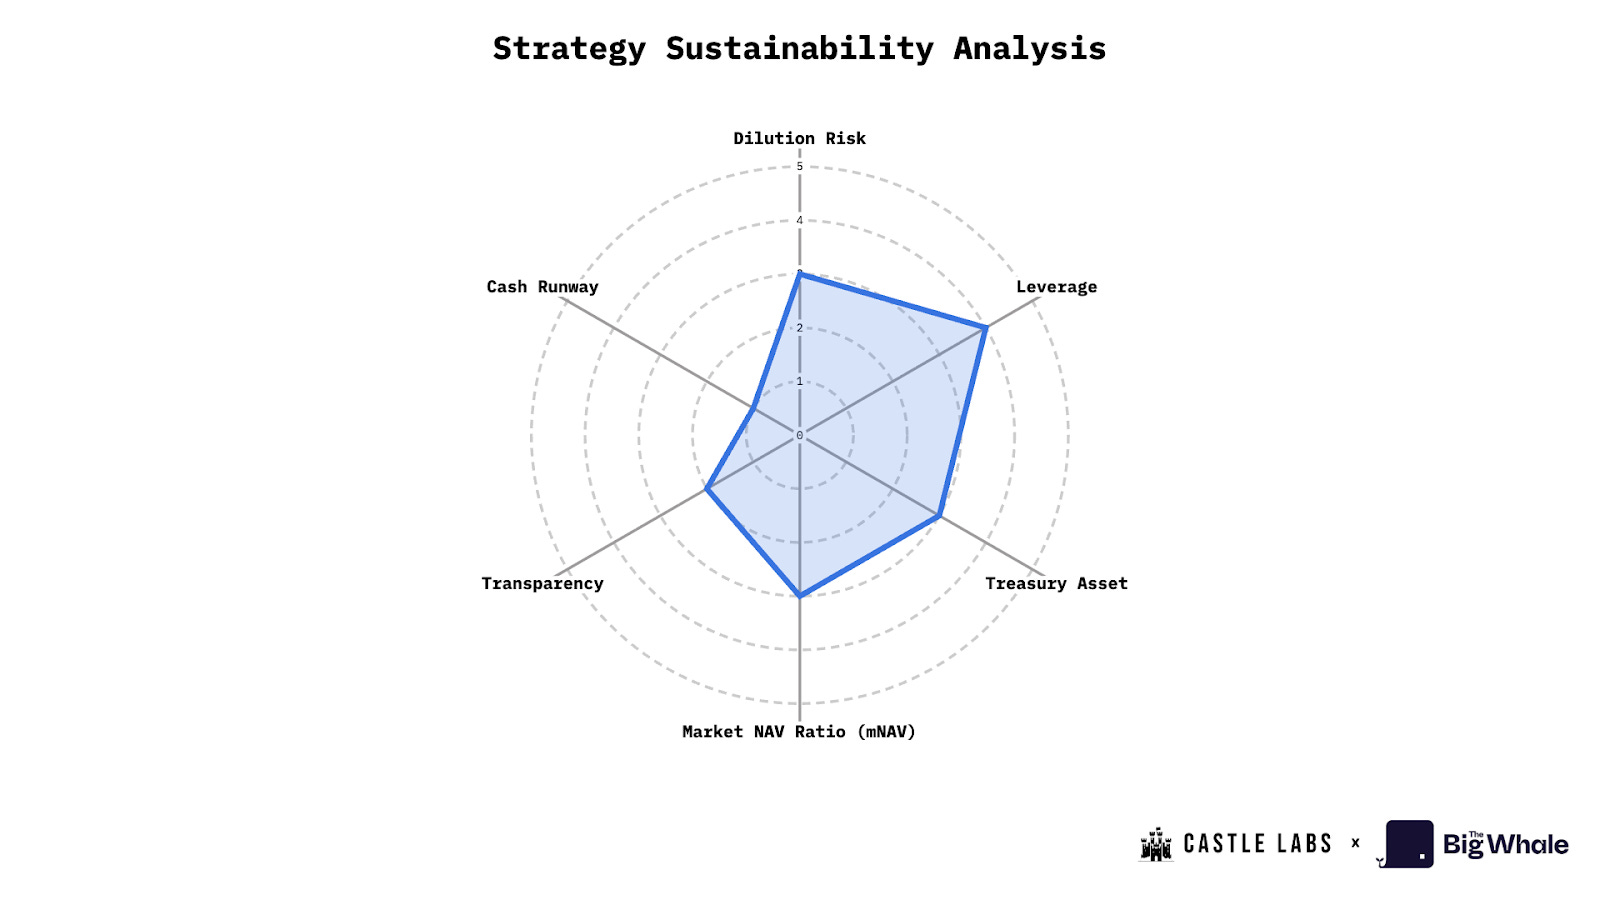
To put everything into perspective and provide a better understanding, we have included the sustainability analysis in the chart below. Remember, the higher the score, the better the DAT performance in that metric (e.g., a higher score in leverage indicates a relatively low level of debt and good performance in that metric).
In the case of Strategy, the average score based on the above six categories, including Dilution Risk, Leverage, Treasury Asset, mNAV, Transparency, and Cash Runway, is 2.83 out of 5.
Conclusion
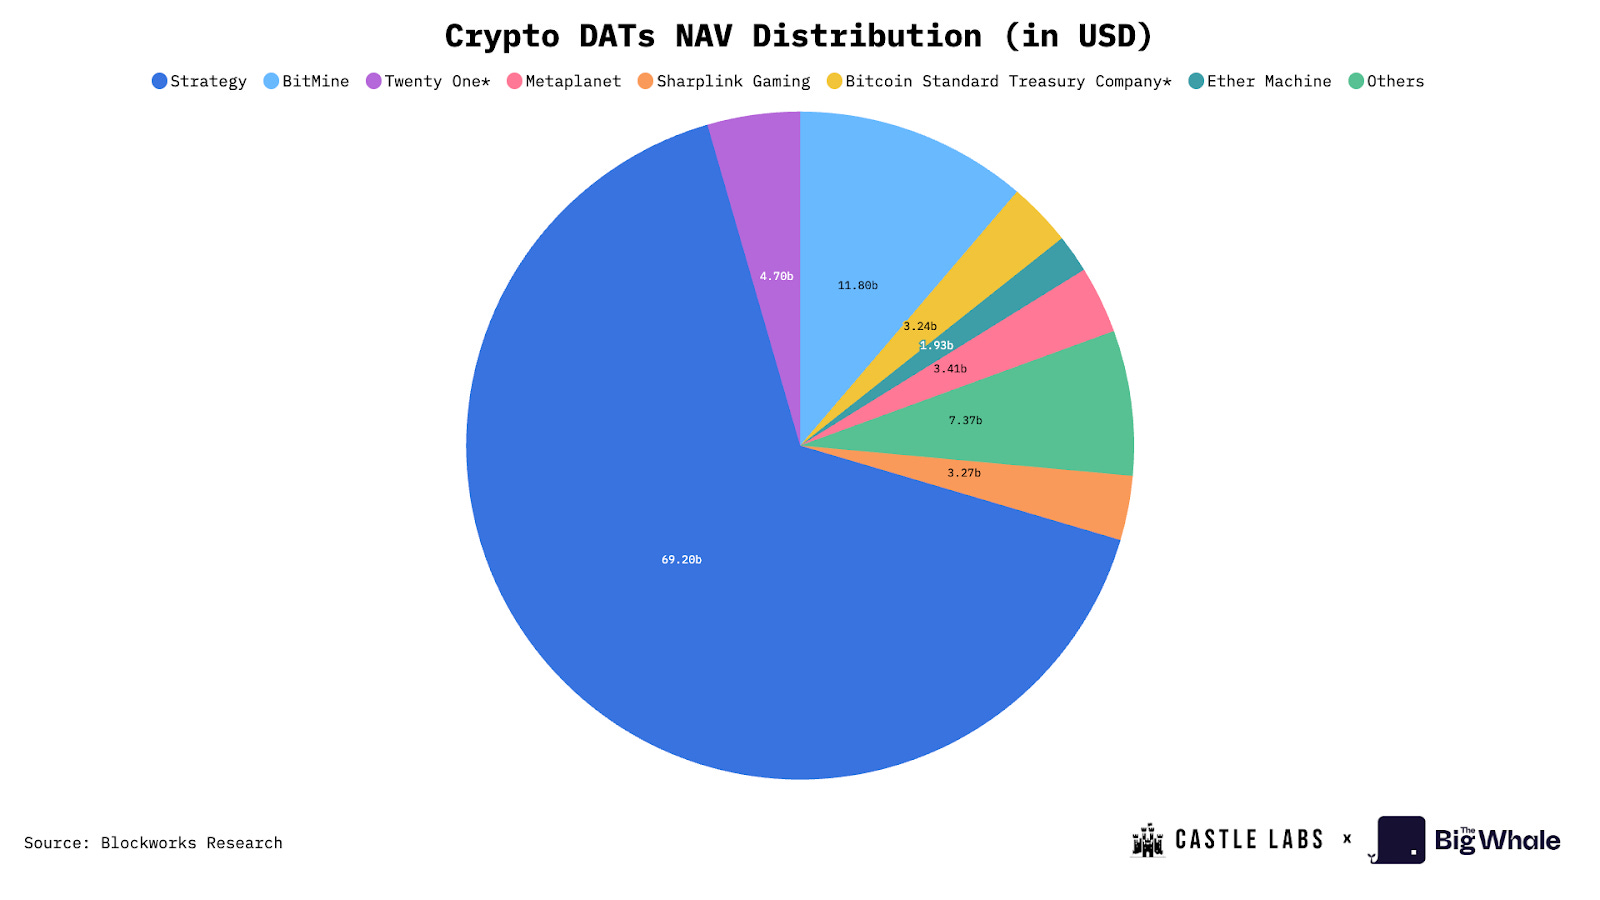
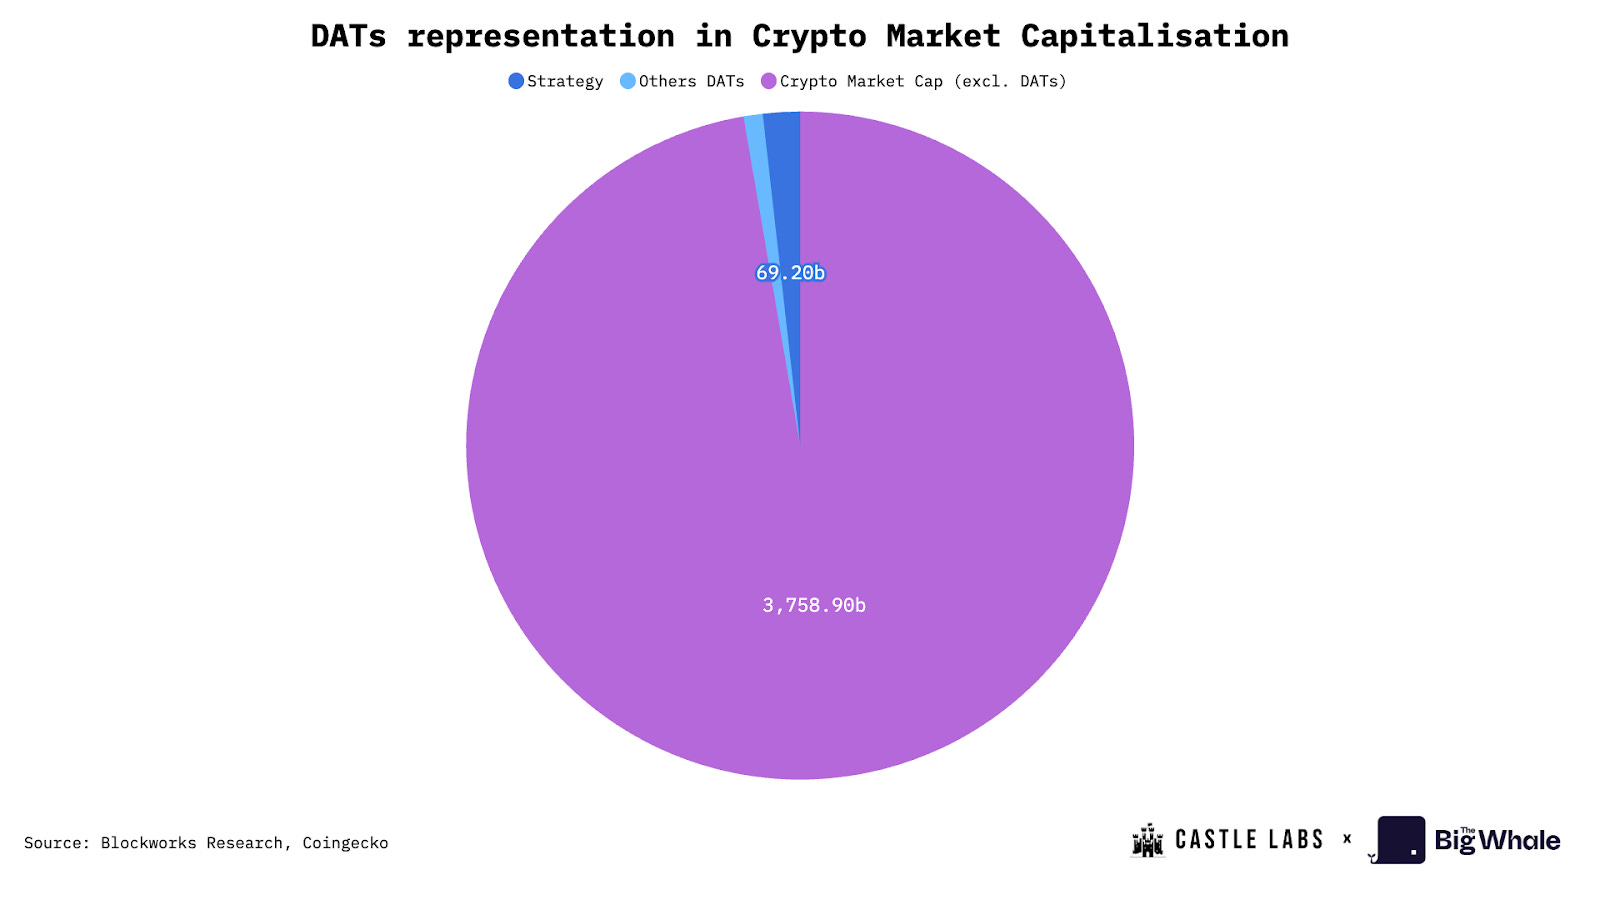
DATs have grown significantly in the industry, with a cumulative NAV of approximately $108 billion, representing 2.5% of the total cryptocurrency market capitalisation. This number is considerable, and when you consider the largest player, Strategy, it owns 3% of the total bitcoin supply. Aside from these numbers, DATs introduce an interesting model and serve as an “equity-funded accumulation vehicle,” allowing traders and other institutions to gain exposure to the underlying assets without actually holding or trading them. The primary reason for this trade is to capitalise on the discount/premium at which the company’s stock is currently trading.
DATs are now expanding beyond blue-chip assets like Bitcoin and Ethereum, including Solana and other L1 assets. These additional assets allow further leverage by DATs, as they can be used to earn yield on their holdings through DeFi. This generated yield can be used to run the company’s operations or to boost business-level metrics. As an example, staking ETH increases the company’s treasury holdings of ETH, which in turn increases its ETH per share value, a valuable metric that investors evaluate before investing in the stock.
The growth of these DATs and their crucial business metrics is highly dependent on the prices of their underlying digital assets. In times of higher market volatility, their mNAV can drop significantly.
In the end, the spike in the number of DATs and their NAV also reflects greater institutional and retail interest in digital assets, which is net-positive for the space. However, anyone investing in these vehicles should be aware of their risks, as mentioned in the report.
This piece is also published on The Big Whale website and is available for viewing here.
 | A guest post by
|
 | A guest post by
|