

User Retention Analysis for Incentive Programs
A Compound Finance Case Study
“Show me the incentive and I'll show you the outcome.” - Charlie Munger
To boost growth or the bootstrapping of new products, protocols, ecosystems, and DAOs often resort to incentives. While these incentives can be deemed more or less effective according to a range of traditional metrics, their effectiveness should encompass a deeper look into retention.
For a program to be successful, its impact should be visible and sustained even after the program ends.
In this report, we analyse the retention of Compound Finance users within Arbitrum’s Long-Term Incentive Pilot Program (LTIPP) and share our key findings, which can be leveraged and taken into account for future programs.
So, how can one measure the success of a protocol?
In this case, success stems from growth, and growth in a protocol is achieved through the acquisition and increase of new users, as well as sustained usage from existing users. Hence, apart from looking at top-line metrics, understanding the behaviour of new and existing users is key to determining if a protocol is growing.
One way to analyse this is using retention-based analytics. This analysis examines whether users initially drawn to a protocol continue to find value in it over time or quickly abandon it. A high retention rate indicates sustained engagement and a product that effectively meets user needs.
Unfortunately, concrete examples of retention analysis applied to incentive programs or protocols remain limited. Therefore, it becomes crucial to demonstrate how this approach can offer valuable insights into a program's overall success.
To illustrate what can be done in retention analysis, Compound's performance within Arbitrum’s Long-Term Incentive Pilot Program (LTIPP) is used as a case study. Note that this is not a performance evaluation of Compound itself. Instead, the goal is to demonstrate how retention-based methods can inform the design and implementation of future incentive programs, leading to more effective and sustainable strategies.
The charts and data are taken from our Compound Retention Demo Dune Dashboard.

The Compound Case Study
Compound received 1.8 million ARB, the largest grant in Arbitrum DAO’s Long-Term Incentive Pilot Program (LTIPP).
The goal: stimulate lending activity and boost total value locked (TVL) on Arbitrum by incentivising deposits into Compound V3.
The compound’s architecture could not natively distribute ARB via its smart contracts. To work around this, the team coordinated with a set of external distribution partners, including:
OKX: a centralised exchange with a DeFi earn section that routes user deposits into Compound, with users receiving ARB as a reward
Vaultcraft: a DeFi-native protocol distributing ARB via boosted APRs
Merkl: used in early phases for retroactive airdrops
Layer3: offered quest-style reward campaigns for onboarding new users
Furthermore, Compound incentivised structured products like Torque and Contango to encourage the borrowing side of the market.
Notably, this report does not holistically segment and analyse these various distribution efforts; however, it does provide a focused look at users onboarded via OKX.
Setting Parameters
Before beginning our analysis, we need to set the high-level parameters of the study by answering these four questions:
What counts as a user? Given that the main goal was to increase depositor volume, a user is defined as someone who has supplied interest-bearing capital. Therefore, borrowers and non-interest-bearing supply collateral are excluded in this context.
What is the usage success metric? Depositor volume is one of the key goals that Compound is driving and attracting; therefore, the incentive program should be evaluated to determine whether it is achieving this goal.
What time interval should be used? Analysis should be conducted monthly due to the slower nature of lending protocols. As they grow their balance, they may be passively adding to their positions over time.
Are there more ways to describe these users and their behaviours for further segmentation? Yes, it's possible to examine their origins. In this context, their deposit size and transaction counts are examined, along with their origin.
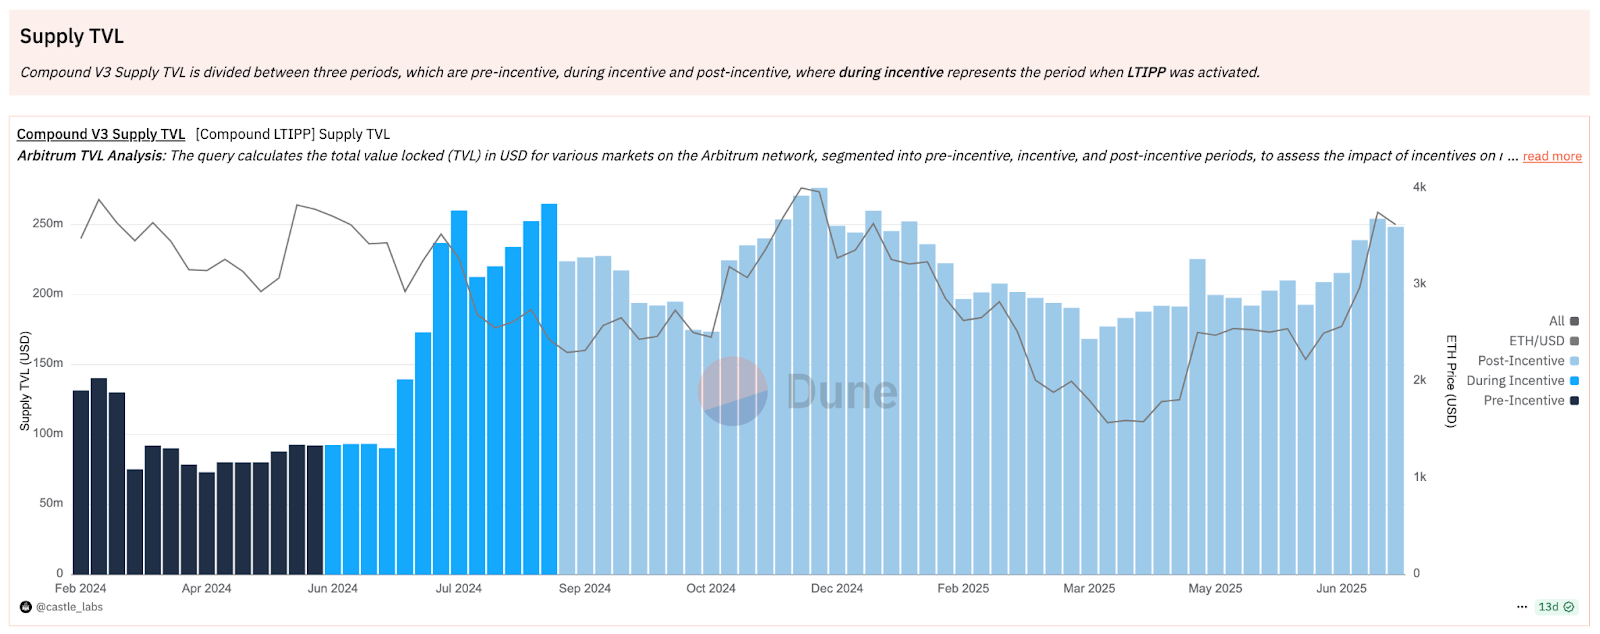
The Compound V3 supply TVL is analysed across three distinct phases, as illustrated in the chart below:
Pre-incentive: Before June 2024
Incentive: 01 June 2024 - 31 August 2024
Post-incentive: After 31 August 2024
New vs Existing Users
To determine a base level of user retention, we first analysed both new and existing users in terms of their deposit flows.
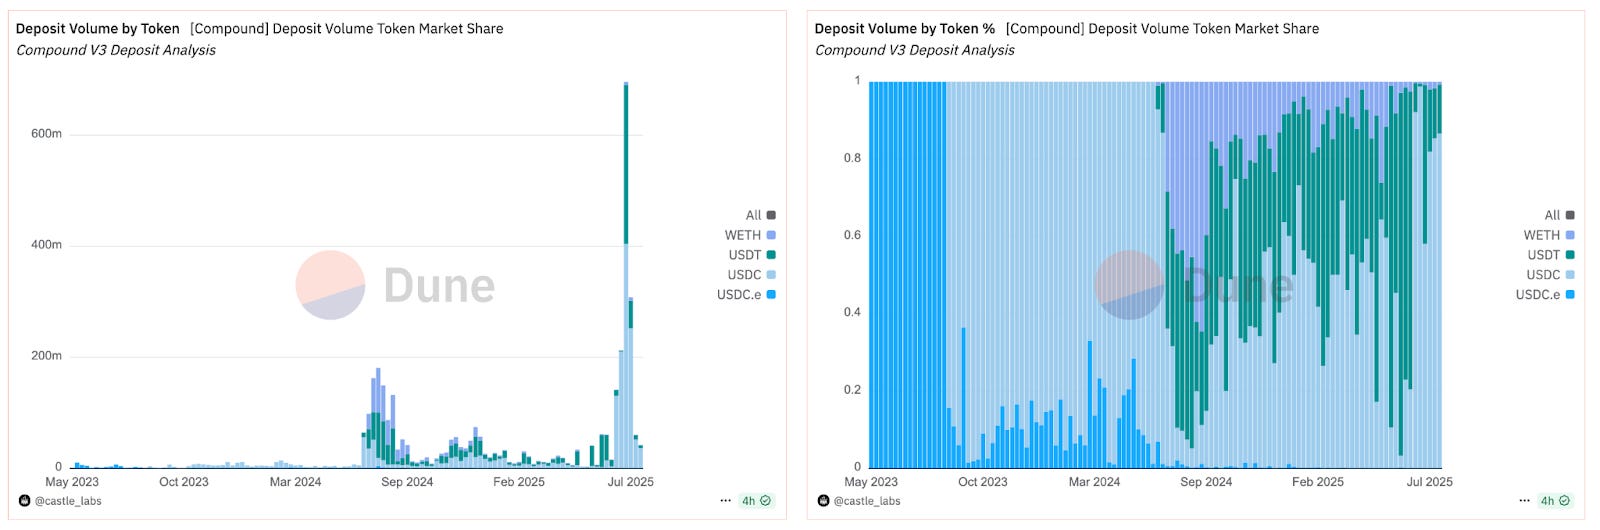
The charts below show the total deposit volume segmented by new and returning Compound users across a range of assets.
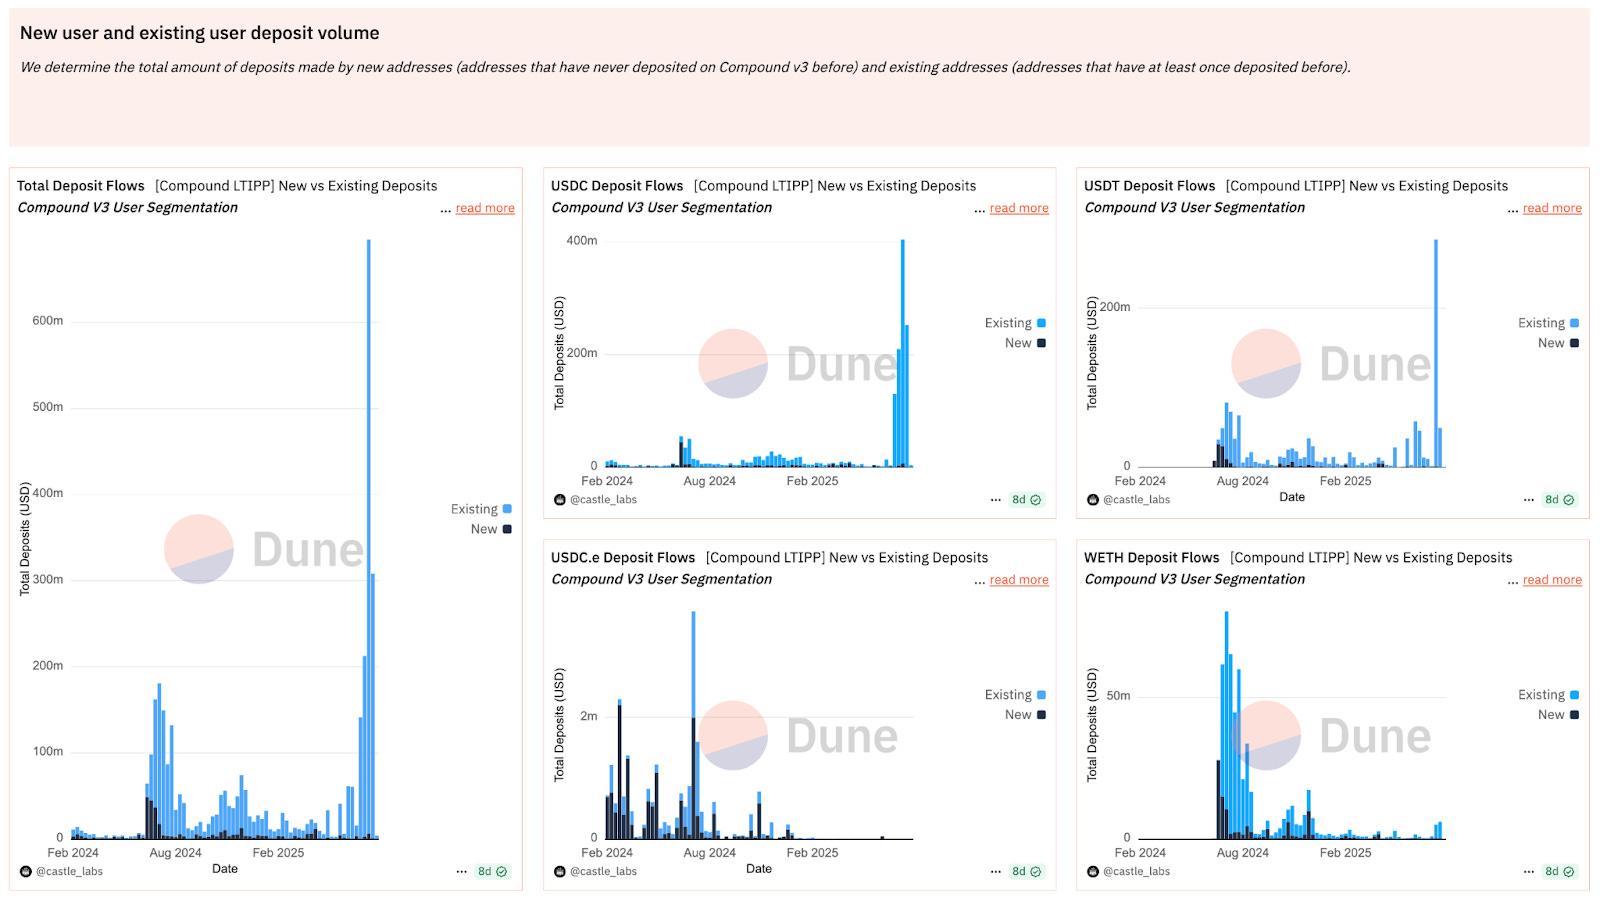
During the incentive period, which began the week of June 8, 2024, there was a significant spike in deposit volume that occurred mainly in July, raising supply TVL by 180% from ~$90m to ~$260m. This volume was driven more notably by returning users, as indicated by the sky blue parts of the chart, who were responsible for 4.5x as much volume during the incentive period as those newly onboarded. The spike in volume was more evident in USDC ($34 million), USDT ($35 million), and WETH ($28 million), as opposed to USDC.e ($0.5 million), which was not incentivised during the program. This trend reflects a strong user preference for incentivised tokens, with much lower deposits for non-incentivised tokens.
Cohort Retention Analysis
To examine users' deposit volume, we utilised cohort tables and segmented them based on their activity across months.
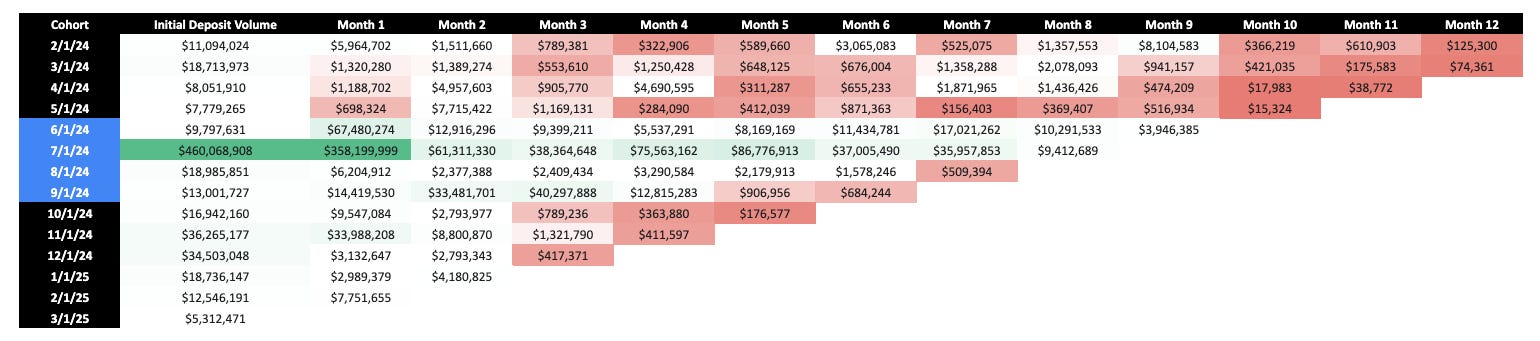
Notice how the new users onboarded in February 2024 generated $11.05 million in deposit inflows within their first month. Three months later, they generated only $0.78 million, and within 12 months, this number decreased to $74k, indicating a significant reduction in depositor volume over time.
In the cohort table above, the blue zone represents the new users who were onboarded to Compound from June to September. The initial volume is similar to that of other cohorts, except for July 1st, 2024, where Compound ramped up its experiments with incentive partners. However, in the later months, the deposit volume remains high compared to that of users onboarded outside the incentive period.
For example, at month 6 (after the cohort was onboarded), the average depositor volume from those in the February 2024 to May 2024 cohorts (pre-incentive period) was $1.3 million. However, when observing the June 2024 to September 2024 cohorts (the incentive period), they have an average deposit volume of $12.6 million. This means that users onboarded during the incentive period deposit nearly ten times as much in month 6 of their onboarding vs. those onboarded before the incentive period.
However, it is worth mentioning that the initial volumes and the size of the onboarded cohort can distort absolute dollar amounts. Therefore, normalising by using the initial cohort as a base makes it easier to compare across these groups.
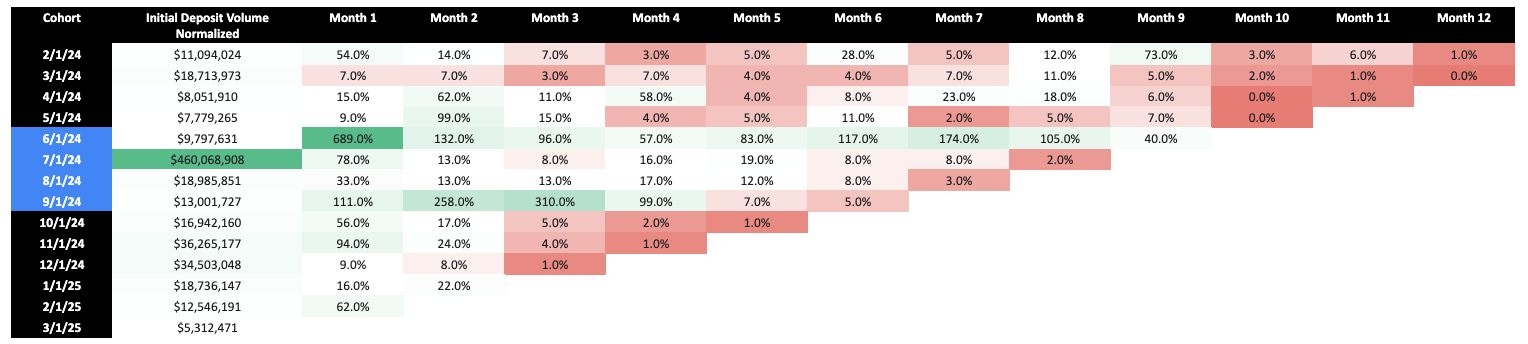
In the above table, most of the deposit volume is less than 100%. This suggests that users are not depositing as much as they did initially, compared to their first deposit. For example, in the August 2024 cohort, Month 1, the depositor volume generated is 33% of $18.9 million, or $6.2 million of the initial depositor volume.
Except for June 2024, an outlier, the generated depositor volume from July 2024 to September 2024 averaged 7% of the initial deposit. In contrast, from February to May 2024, it was 12.8%, implying that growth in TVL primarily came from the initial burst of the depositor’s volume before it tapered off over time.
User Analysis
From the above analysis, there are some indications that the incentive program could be considered effective, as it leverages and characterises the properties of the users who participated. User analysis also helps in understanding the profile of retained users and in developing strategies to attract more such users, so that when incentives cease, they remain engaged.
First, it is necessary to define what constitutes a retained user. This is particularly challenging in the context of Compound, as its usage pattern is characterised by non-contractual continuous usage, where users do not have a set expiration date for their use, and they can enter and exit Compound at any time. This renders traditional churn definitions, such as the lack of contract renewal typically seen in SaaS-based businesses, inapplicable, and a new set of definitions is needed to determine inactivity.
Therefore, thresholds need to be set to define users who engage with Compound even months after their first deposit. The chart below helps identify this threshold, allowing us to differentiate between users who found value in Compound and continue to use it, and those who become inactive over time.
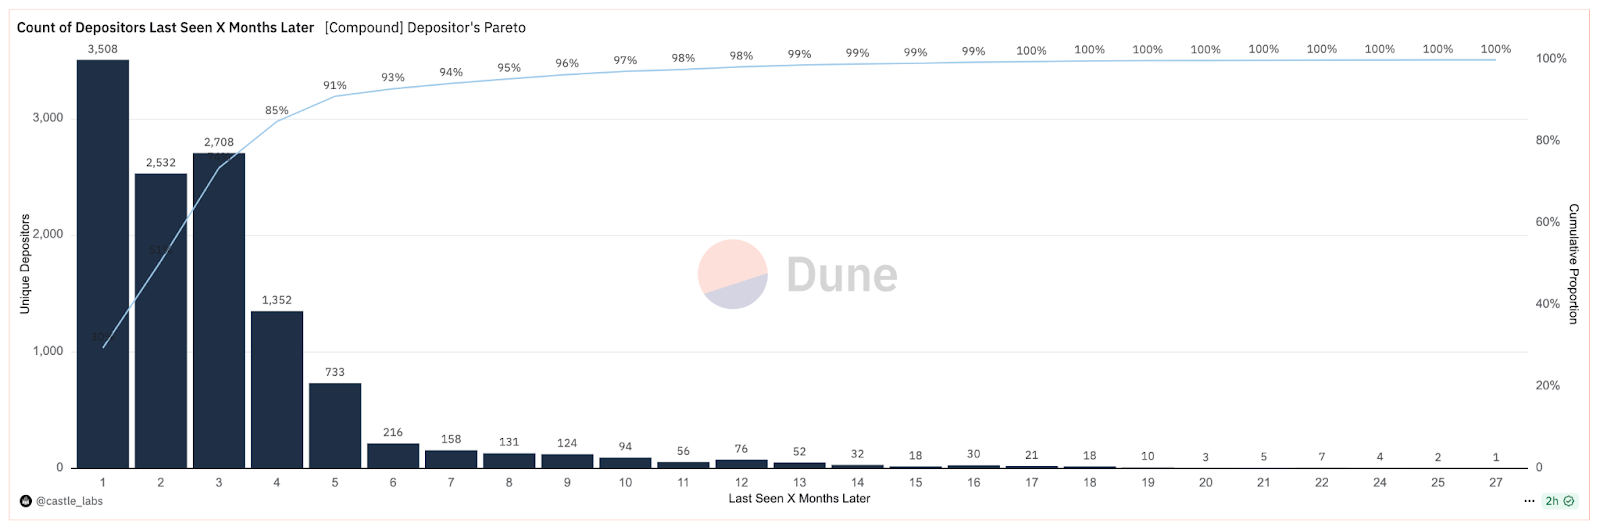
This chart confirms that many compound users do not continue to use the platform in the long term. Deposit behaviour reveals a trend of declining engagement after the first deposit. For example, reading the chart above, 3,508 unique addresses made at most one additional deposit within a month of their initial deposit and then ceased activity.
Based on the chart, there is a steep drop-off in the maximum number of months users return in the 6-month mark, which suggests that most users don’t use Compound after 6 months. This insight helps in labelling what counts as retained users.
Note that the term “churn” is avoided because the user behaviour profile is in a non-contractual, continuous setting. Users can be reactivated at any time, so the more appropriate term is “inactive”.
Therefore, the following classification method to determine Retained vs Inactive users is used as follows:
Wallet Sampling: The intent is to understand behaviour only from users who are older than 6 months. This is because it is difficult to determine the potential behaviour of newer users, as there is insufficient historical data available.
Retained Users: Wallets that are more than 6 months old and have returned to use Compound within the past 6 months are considered retained.
Inactive Users: Wallets that are more than 6 months old and have not used Compound within the past 6 months are considered inactive.
The period from June 3, 2024 (the start of LTIPP) to the present will be used to analyse these users.
Retained User Behaviour
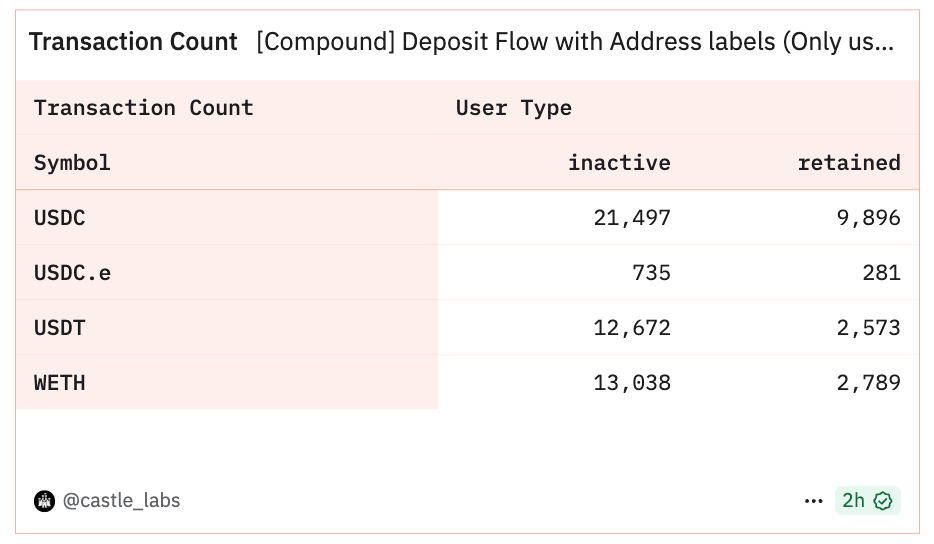
The data below shows Compound deposit flows, comparing "inactive" users to "retained" users. The data is broken down by asset (USDC, USDC.e, USDT, WETH). The information presented covers:
Average USD Deposit Flows: Compares the average dollar value of deposits from inactive vs. retained users for each token.
Transaction Count: Compares the number of transactions made by inactive vs. retained users for each token.
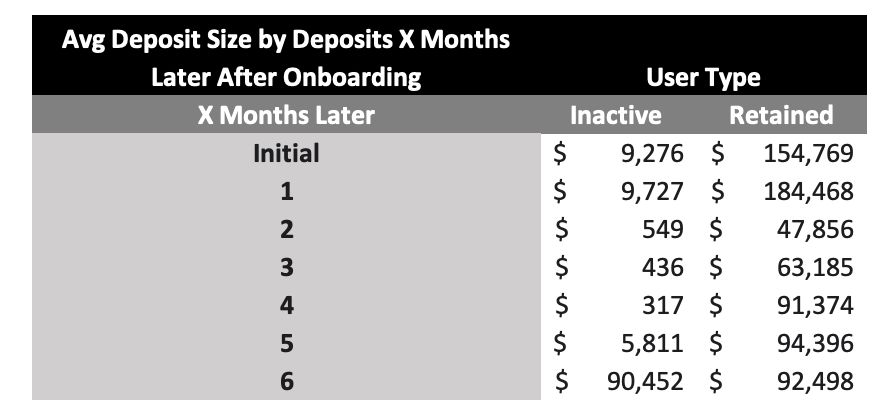
The following table represents the average USD deposit flows among inactive and retained users. The table indicates that retained users make larger deposits and remain longer.
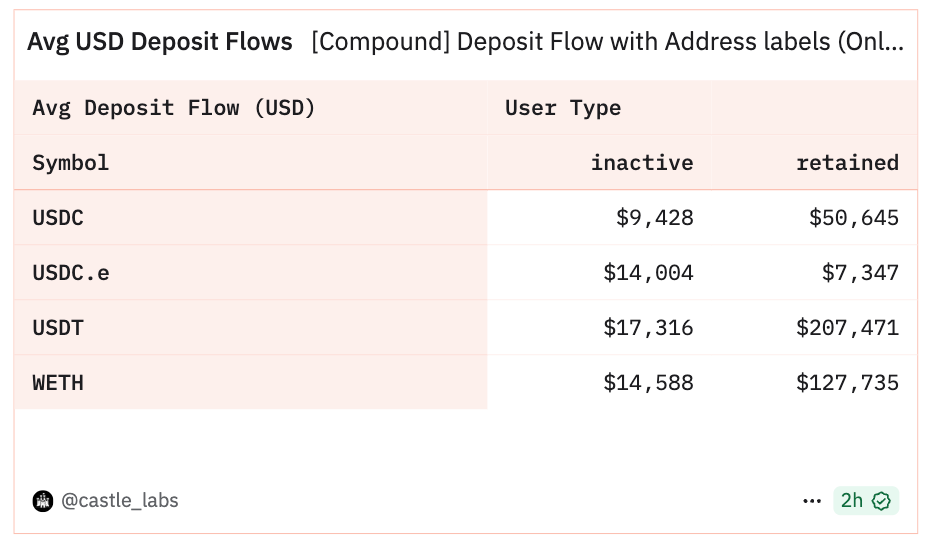
Additionally, the sustained use of USDT was immensely beneficial. Compound used the incentive opportunity to start a USDT pool, which drove a considerable part of the depositor’s volume and even represents ~30% of the depositor’s volume to date.
The lower transaction volume among retained users provides some assurance that these users may not be Sybil in nature, as they are committed to depositing funds for yield and are not engaging in spam transactions. Although a deeper Sybil analysis can be conducted to validate the nature of these retained users, it generally suggests that users with higher average deposit volumes are those who utilise the protocol for its intended purpose and, therefore, tend to stay longer.
OKX Onboarding Program
During the incentive program, Compound partnered with OKX to reward users who deposited funds on Compound via OKX’s DeFi product. Users who made deposits to OKX were rewarded with ARB. Through this program, Compound was able to open a new distribution channel and onboard a new set of users.
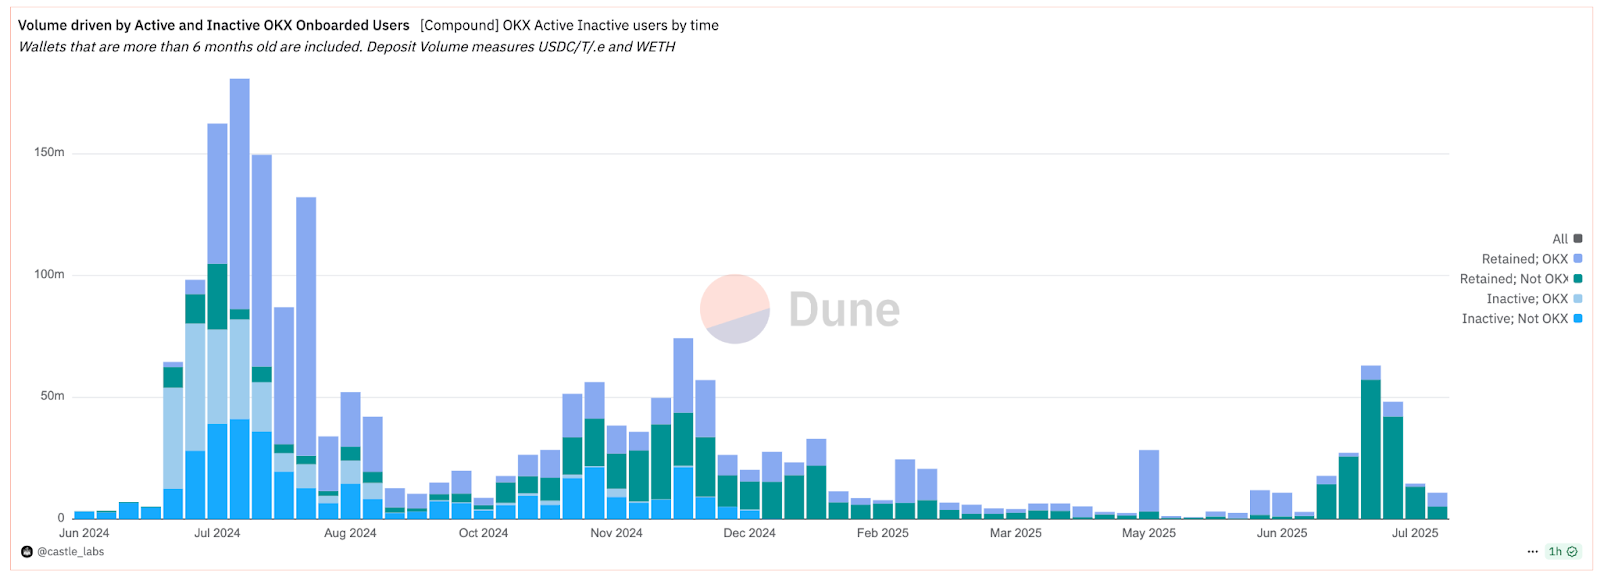
The chart defines onboarded OKX users as those who first used Compound through OKX, and non-OKX users are those who used Compound before the OKX incentive period.
Initial Volume Surge: The chart displays a significant surge in deposit volume during the incentive period, particularly around July and August 2024. This supports the claim that the program was effective at attracting deposits.
OKX Onboarded Users Dominate: The purple portion of the bars, representing active wallets onboarded by OKX, generally comprises the largest segment of the total deposit volume over time. This indicates the program's success in attracting and retaining users who are actively onboarded via OKX.
Inactive Wallet Volume: While blue and sky-blue segments (inactive addresses) are present, especially during peak periods, their overall impact is relatively less than that of active users (purple and green). This suggests that mercenary capital, driven by incentives, exists but doesn't dominate the long-term volume as expected. Fortunately, the depositor’s volume from mercenary users does not dominate the deposit volume chart empirically.
Post-Incentive Decline: While volume remained elevated for some time after the peak, there was a clear decline in volume towards the end of the charted period (Dec 2024-Mar 2025). While this is not ideal, it highlights the need to continuously onboard new users through various channels to introduce a diverse mix of user classes.
Key Findings
1. Incentives Successfully Drove New and Returning Capital
Deposit volumes spiked during the LTIPP, especially between July and September 2024. This growth was driven by both returning users and new users who were onboarded, confirming that ARB incentives helped Compound re-engage prior users and attract fresh capital.
2. High-Capital Retained Users Delivered Outsized Impact
While many users churned over time, a small group of retained users deposited significantly more capital and sustained it longer. For example, retained users averaged $154K in first-month deposits, compared to just $9K for inactive users. Therefore, targeting high-capital users early appears to be a more efficient use of incentives than broad distribution.
3. OKX Distribution Method had a Positive Effect
The segmentation conducted on OKX onboarded users showed:
OKX users accounted for the majority of deposits during the incentive peak.
Non-retained (mercenary) capital existed but did not dominate total TVL.
This underlines the value of tracking entry channel + wallet behaviour, a standard future program should adopt more widely.
4. Stablecoin Pools Outperformed in Retention
Incentives for USDT and USDC led to stronger capital retention than those for volatile assets like ETH. For instance, the USDT pool, introduced during the LTIPP, accounted for ~30% of all deposits at peak. Therefore, as stablecoins produced “stickier” TVL, they should remain a focus in future programs.
5. Most Users Leave Within 6 Months
Across all cohorts, the majority of users stopped depositing within six months of their first activity. This is consistent with usage patterns in non-contractual DeFi systems, but it highlights the need for better strategies to reactivate or retain early users.
6. Program Success Depends on Supply-to-Utilisation Flow
While this study focused on deposit-side growth (TVL), lending is a two-sided market. Sustainable success requires that new deposits also lead to borrower activity and capital utilisation. Future evaluations should measure whether incentivised liquidity is being used, rather than just being parked.
7. Macro Context Matters, But Isn’t Everything
The LTIPP spike in deposits coincided with BTC rallies, raising the possibility of macro-driven lift. But cohort-level data shows many users were returning Compound depositors, suggesting they responded to known yield sources, not just general market enthusiasm. Therefore, we can say that incentives worked as a reactivation lever, not just a marketing spike for new users.
8. Retention Analysis Offers a Clearer Signal Than Top-Line Metrics
Traditional metrics like TVL and user counts can mask behavioural patterns. Cohort-based retention analysis reveals what’s truly working: who stays, who leaves, and which user profiles deliver lasting value.
Conclusion & Reflection
The Arbitrum DAO LTIPP program provided incentives for Compound Finance from June 2024 to August 2024. These incentives were targeted to increase the depositor’s volume in the protocol. The analysis of the data concluded that reactivated users drove the majority of Compound growth during the period. These users had previously used the platform, rather than being newly acquired, which suggests that Compound’s incentives successfully brought back users who had already found the product helpful.
This retention analysis of Compound’s LTIPP participation demonstrates the clear value of cohort-based analytics compared to traditional metrics, such as TVL, volume, and user counts. While these top-line numbers offer a surface-level view of growth, they can obscure the underlying dynamics of user engagement, sustainability, and product-market fit. By segmenting users over time, we gain a far richer picture of who stays, who leaves, and what behaviours correlate with long-term contributions to ecosystem growth.
Importantly, the study illustrates how macro trends and product affinity can interact in subtle ways. The deposit surge during LTIPP may have coincided with BTC rallies, but the data indicates that the growth stemmed from reactivated users within the same program, rather than from newly acquired ones. This suggests that Compound’s incentives successfully brought back users who already found the product useful, a different kind of success than pure acquisition, but one that can still deepen ecosystem liquidity when timed and targeted well.
Future incentive analyses should retain this dual lens: benchmarking against external market share while using retention segmentation to isolate true behavioural change.
The study also reinforces the need for protocols and the DAO to define clear user-level success criteria upfront. Incentive programs that focus only on outcomes like TVL risk mis-attributing mercenary capital as sticky growth. Instead, success should be measured by identifying high-value users early, tracking their behaviour over time, and iterating on distribution mechanisms accordingly. This means designing around user profiles, entry channels (e.g., OKX), and deposit behaviours, not just program-level emissions.
More broadly, cohort-based evaluation should become a standard diagnostic tool for future incentive programs, particularly in verticals such as lending and trading, where user lifecycle and capital dynamics are complex. Pairing this approach with live dashboards and reporting infrastructure would allow for real-time diagnosis of which segments are delivering value and which are not. Ultimately, retention analysis isn’t a replacement for top-down benchmarking, but a necessary second layer for understanding what’s truly working, where capital is compounding, and how to improve capital efficiency across programs.